INTRODUCTION
POWER BI is a data analysis tool [ Software] which can help us to analyze the data in the lightening speed.
CLICK HERE TO LEARN THE BASICS OF POWER BI
We already learnt the basic procedure of importing data into POWER BI through an example taken for the
insertion of data from the EXCEL FILE , MS SQL SERVER and MICROSOFT ACCESS into the POWER BI. In addition to this we learn how to import data from CSV/TEXT file too.
Now we will learn to import the data from WEB which is of immense help for us and most of the information is available on the web.
This options is so easy and useful that we can directly import the data from web, clean it and analyze it.
In this article , we would fetch data from the web and create a visual.
PROCEDURE OF IMPORTING DATA FROM WEB INTO POWER BI
First of all, we should have the link to the page where the data exist.
We should remember that we can fetch the tabular data into power bi from the given link.
Let us find out the record about the cricket world cups since the start.
We could find https://en.wikipedia.org/wiki/Cricket_World_Cup this link for the record. Let us try to fetch the data and see what analysis we can do with this data.
1. Let us find out the number of times any country has HOSTED the world cup.
2. The number of times any country has won the world cup in descending order.
CREATING THE CONNECTION TO THE DATA SOURCE:
THE FIRST STEP IS TO CREATE CONNECTION IN POWER BI.
STEPS TO CREATE CONNECTION IN POWER BI:
- Click the POWER BI icon to execute the file and open POWER BI FOR DESKTOP.
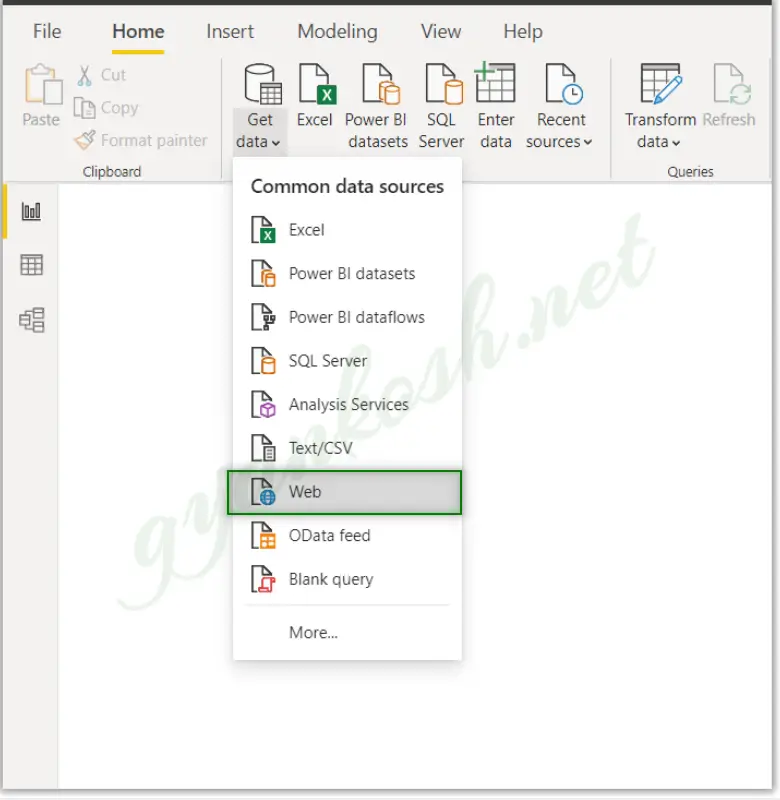
- To create a connection with the data on web, click on GET DATA button.
- In the drop down menu choose WEB, a new windows will open as shown in the picture below.
- After clicking the WEB, a small window asking for the URL will open.
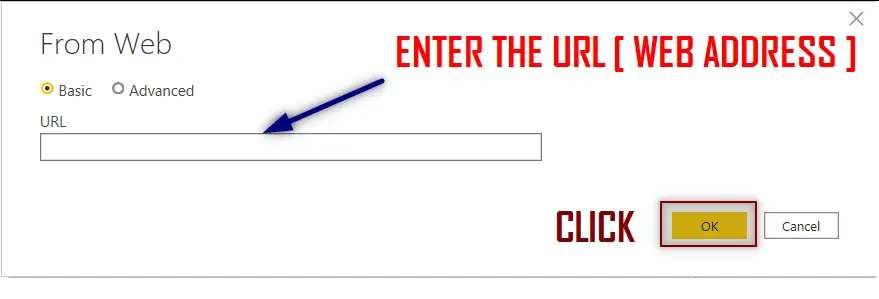
- After entering the URL, click OK.
- The CONNECTOR will connect with this url and scan all the available tables.
- The navigator will open containing all the available TABLES.
IMPORTING THE DATA INTO POWER BI:
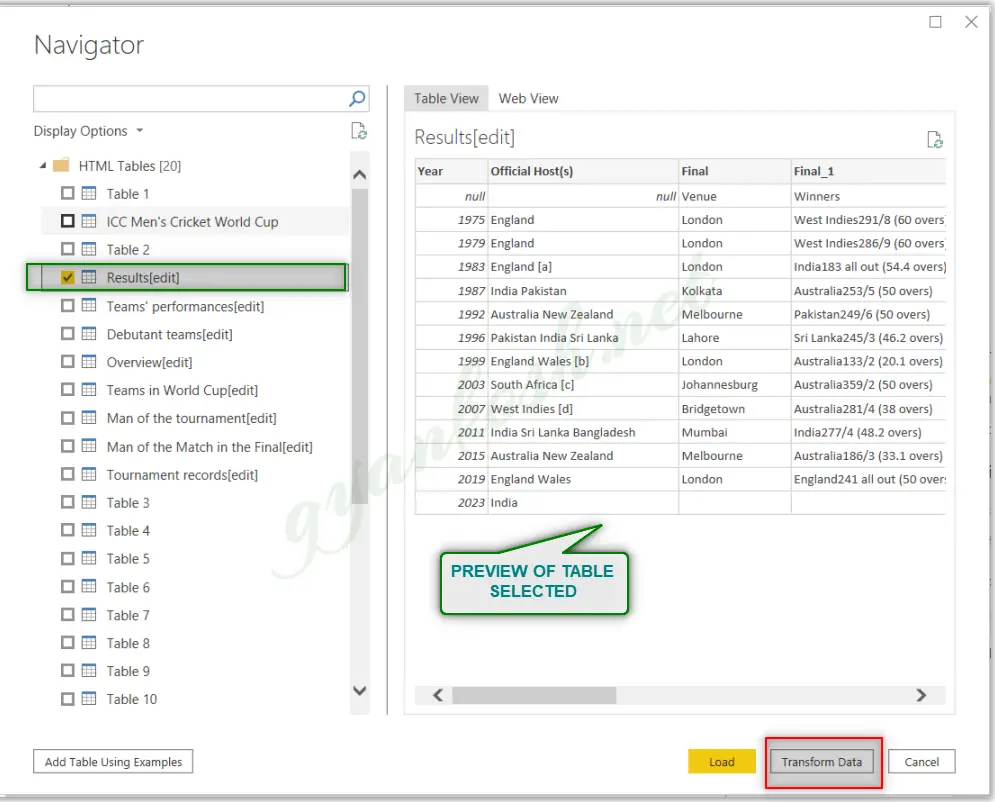
The NAVIGATOR will gather all the data and show it.Let us understand the navigator.
LOOK AT THE PICTURE BELOW.
- The data is available in the navigator.
- If the data is ready [ Clean ], it can be directly loaded by pressing LOAD , if not, and if we need to clean it up, we can choose TRANSFORM DATA.
- We chose the TABLE NAMED RESULTS which we wanted as it contains all the details needed about the matches and winners.
- We can see that the first two values are null which might pose a problem if imported directly.
- So, we use the option TRANSFORM DATA which will open our table in the POWER QUERY.
When we choose TRANSFORM DATA, the data opens up in the POWER QUERY EDITOR.
CLICK HERE TO LEARN THE DIFFERENT PROCEDURES IN POWER QUERY EDITOR.
Following picture shows the data as it loads in power query.
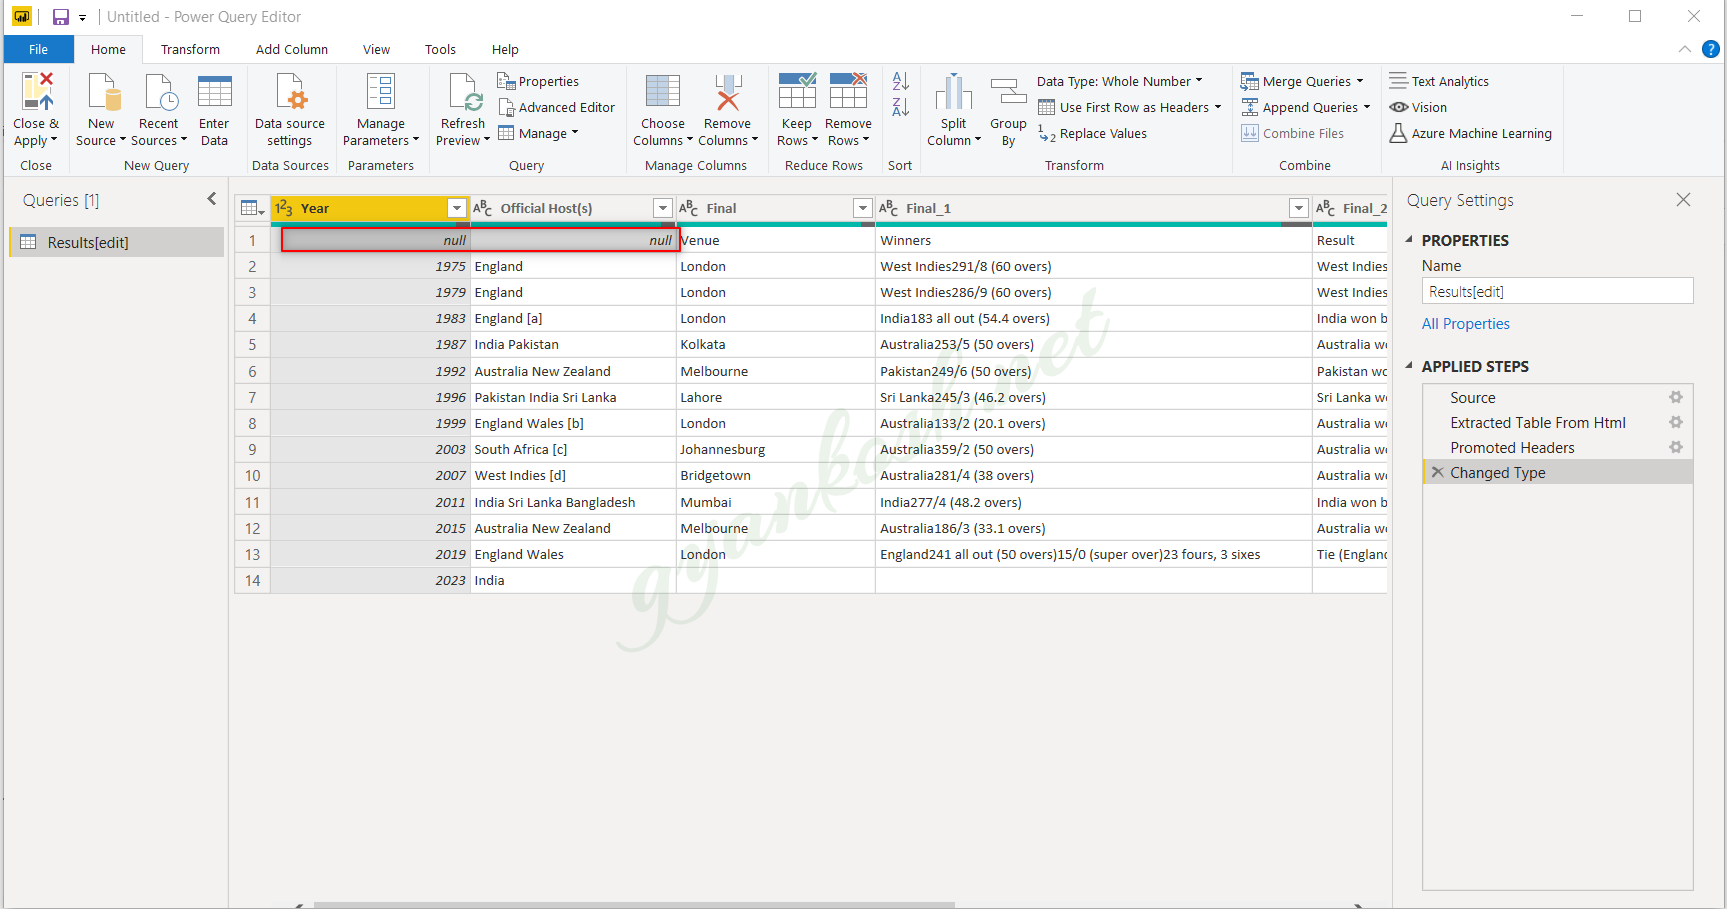
We have the following tasks in the data loaded into power query.
[CLICK HERE FOR IN DEPTH DETAILS OF THE FOLLOWING OPERATIONS.]
In this case, we have just one problem, the presence of null values, so we will remove those lines.
Click the down arrow near the column name and uncheck NULL.
It’ll remove the null values.
One more problem to be solved is removing all the extra data from FINAL 1 other than the winning team name.
For that RIGHT CLICK THE FINAL 1 COLUMN AND CHOOSE SPLIT COLUMN BY> NON DIGIT TO DIGIT.
It’ll split the column into many portions in which the first one will be needed by us and it’ll just contain the name of the winning team.
Delete the rest.
The data after cleaning looks like in the following picture.
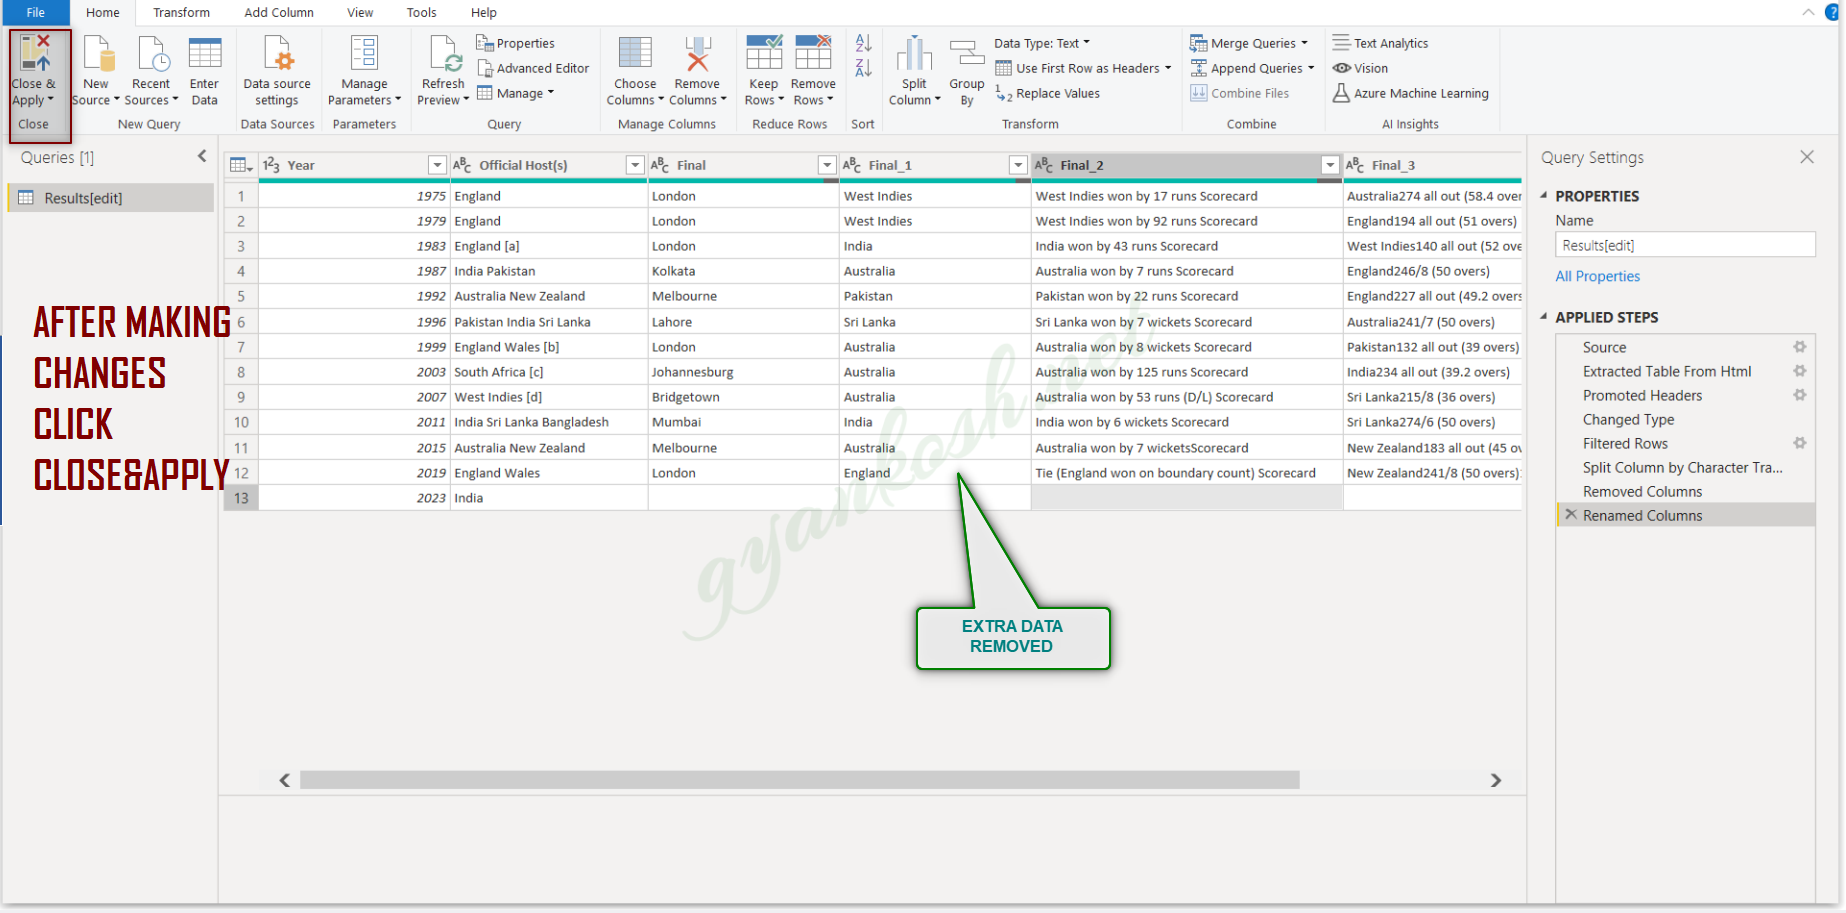
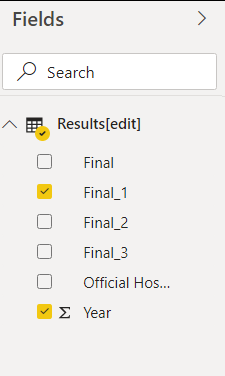
After we click CLOSE AND APPLY , the data would be imported into POWER BI and the table would enter the POWER BI as the fields in the right portion of the screen as shown in the picture below.
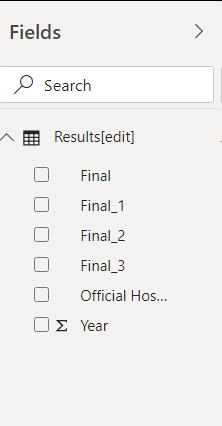
- The fields have been populated in the POWER BI. Now we can choose the fields which we want to include and create any visuals.
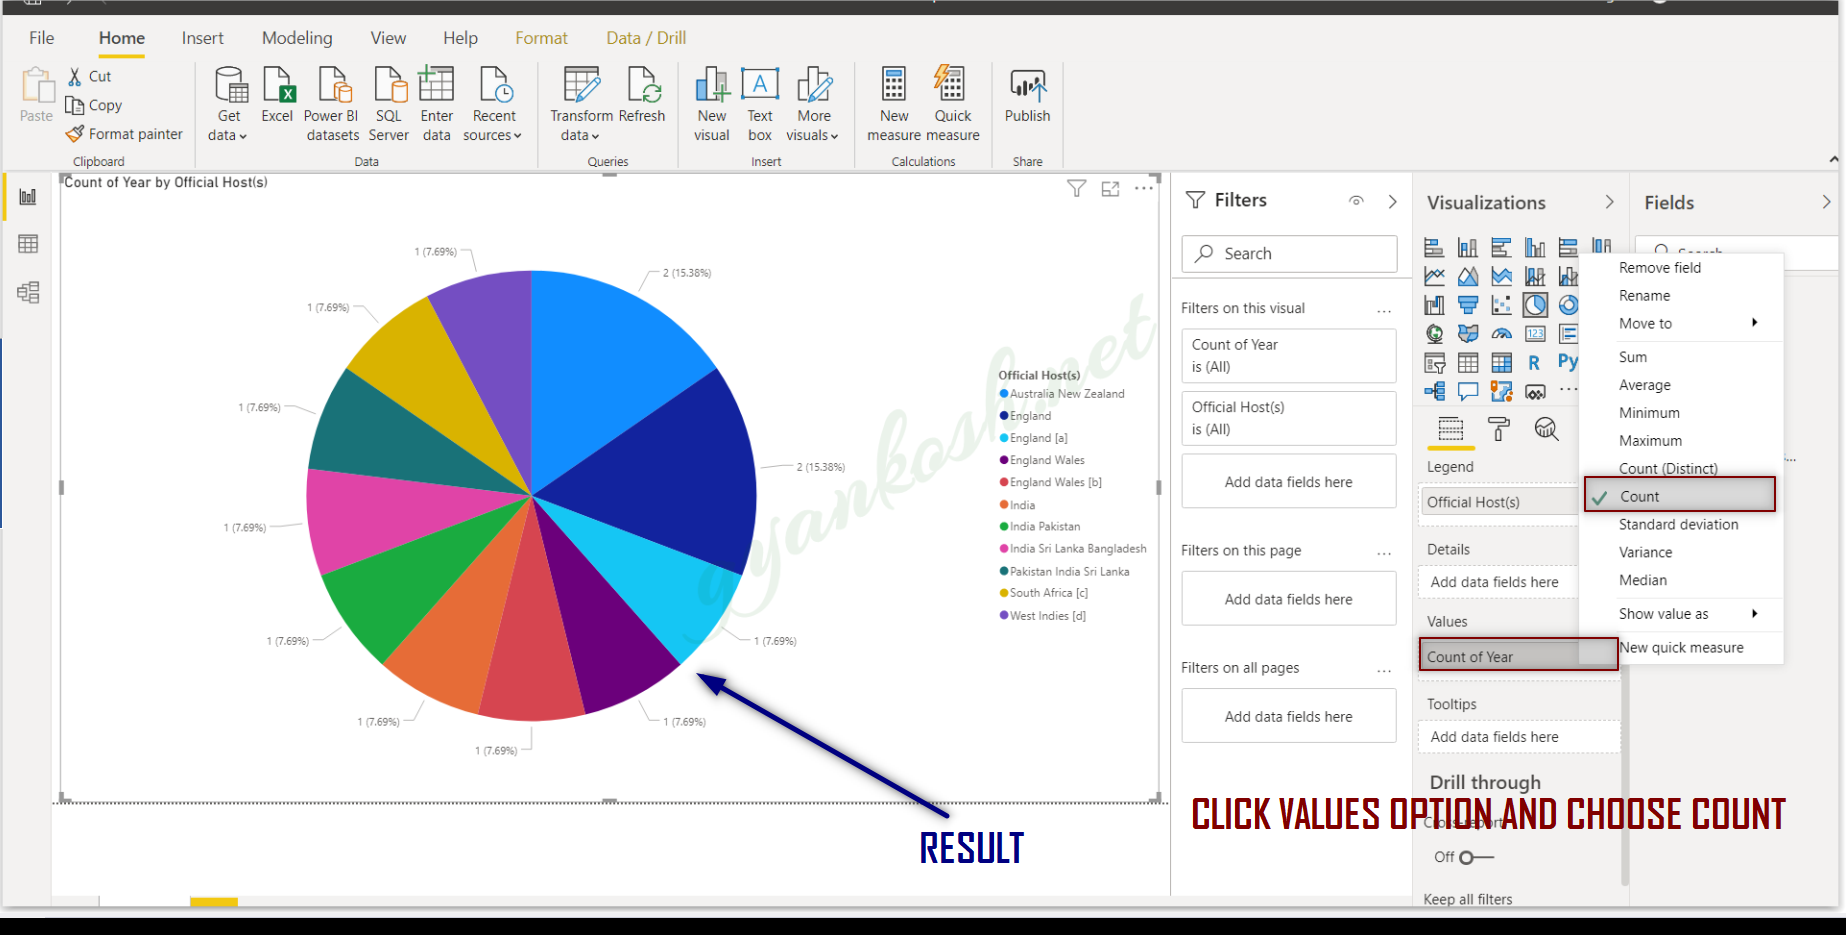
1. FINDING OUT THE NUMBER OF TIMES ANY COUNTRY HAS HOSTED THE WORLDCUP
For this, we need two datafields, YEAR and OFFICIAL HOST.

- By default, the year will be summed up and it’ll show absurd values.
- For that, refer to the picture below and go to VALUES, click YEAR and choose COUNT. It’ll rectify our data and give us correct results.
- Let us choose a PIE CHART for this one.
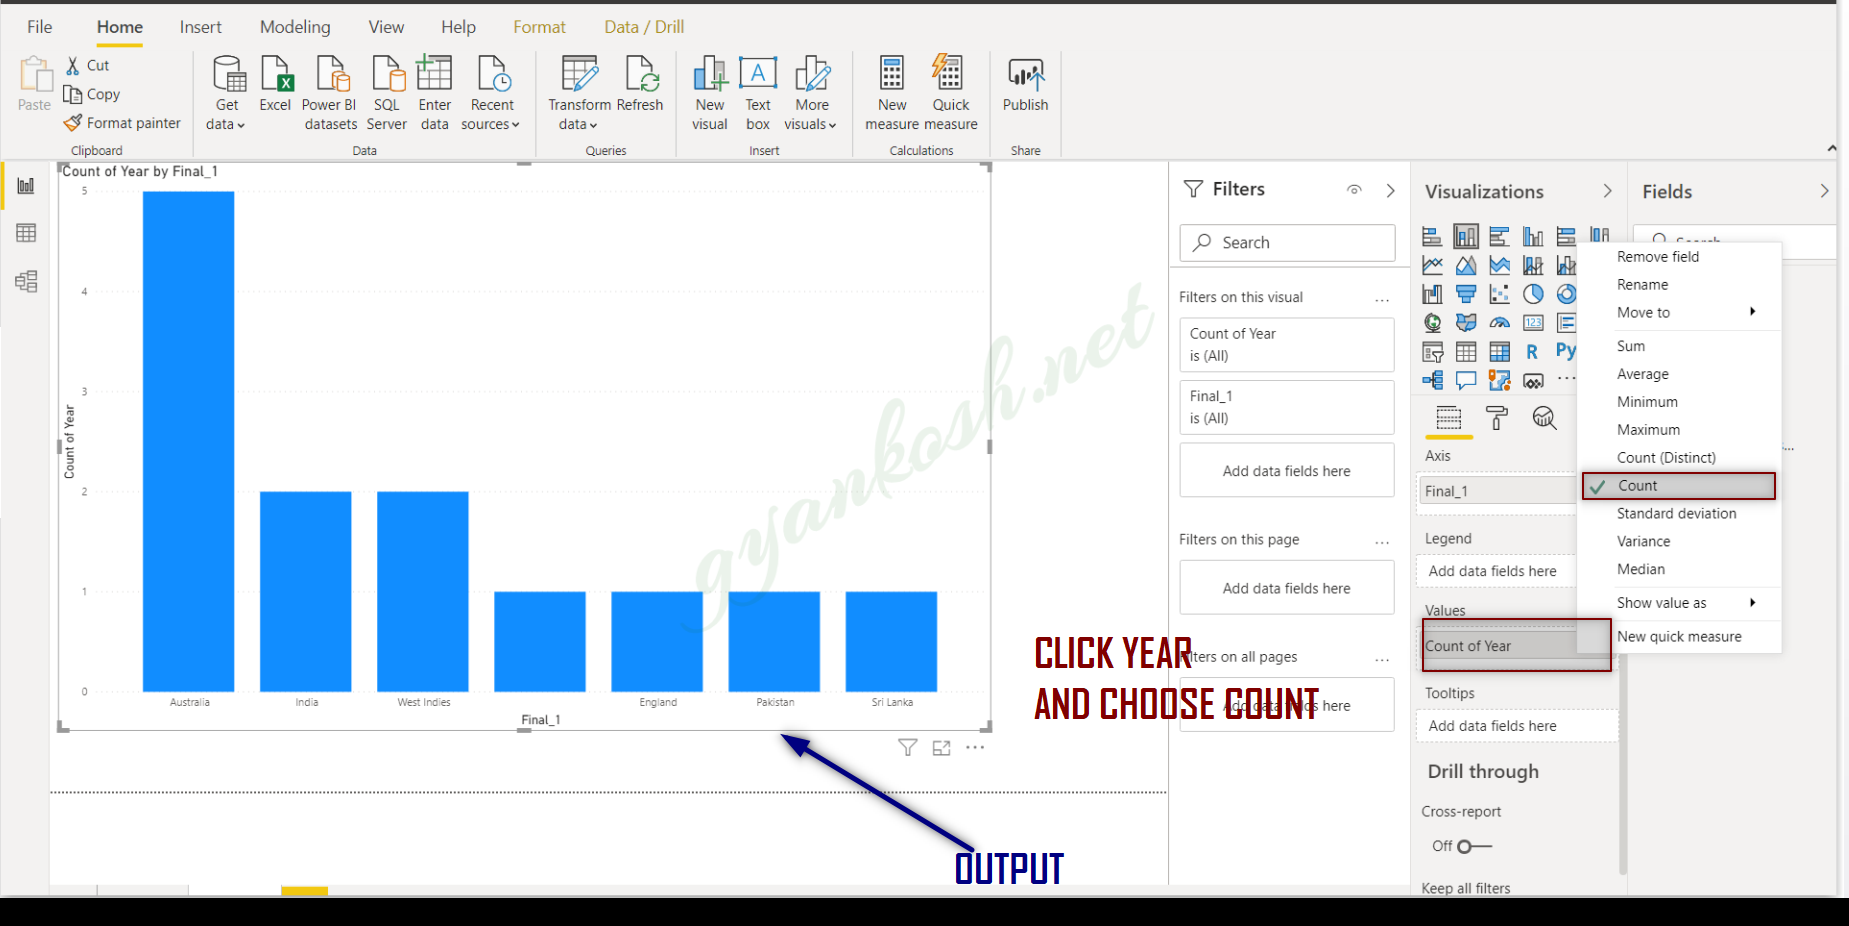
1. FINDING OUT THE NUMBER OF TIMES ANY COUNTRY HAS WON THE WORLDCUP
For this, we need two datafields, YEAR and FINAL 1 [It contains the winning country]
- By default, the year will be summed up and it’ll show absurd values.
- For that, refer to the picture below and go to VALUES, click YEAR and choose COUNT. It’ll rectify our data and give us correct results.
- Let us choose a column chart for this.