Table of Contents
- INTRODUCTION
- TYPES OF DATA SOURCES IN POWER BI
- LIST OF DATA SOURCES IN POWER BI:
- STANDARD PROCEDURE OF IMPORTING DATA FROM DATA SOURCES IN POWER BI [ IMPORT FROM EXCEL ]
INTRODUCTION
In this article, we’ll learn about the different data sources in POWER BI from where we can fetch data easily.
POWER BI is a data analysis tool [ Software] which can help us to analyze the data in the lightening speed.
CLICK HERE TO LEARN THE BASICS OF POWER BI
In our previous introductory post, we learnt the basics of the POWER BI environment. We also learnt that we can bring the data into the POWER BI from a large number of resources and analyze the data. Technically bringing the data into the POWER BI becomes the first step towards the analysis.
So, in this article, we will talk about the various ways and options of fetching the data into the POWER BI environment for the analysis.
We can utilize the data in POWER BI using the two main processes
- CREATING A CONNECTION TO THE DATA SOURCE, AND
- IMPORTING THE DATA INTO THE POWER BI
TYPES OF DATA SOURCES IN POWER BI
POWER BI is compatible with receiving the data from over 100 types of sources.
BROADLY, POWER BI can accept data from the databases like oracle, SQL server, access etc., from CSV, text files, tabular data from websites, cloud services, etc.
LIST OF DATA SOURCES IN POWER BI:
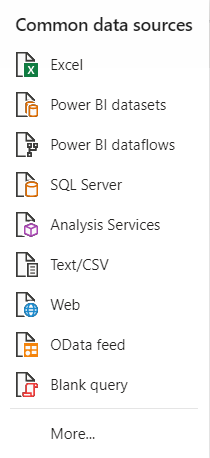
The list of the types of data sources in power bi is shown in the picture below.
We can see that most of the data storing entities are covered such as FILES, DATABASES, POWER PLATFORMS , MICROSOFT AZURE, ONLINE SERVICES such as google analytics and other analytics services and more.
The common types of DATA SOURCES AVAILABLE in POWER BI, which we will be discussed in detail are
- EXCEL
- POWER BI DATA SET
- POWER BI DATAFLOWS
- SQL SERVER
- ANALYSIS SERVICES
- TEXT/CSV
- WEB
- ODATA FEED
Out of these services,we’ll be focusing on EXCEL, DATABASE, CSV and WEB services. Although the process for the other option remains the same.
STANDARD PROCEDURE OF IMPORTING DATA FROM DATA SOURCES IN POWER BI [ IMPORT FROM EXCEL ]
Before we go further, let us try something practical so that it doesn’t become boring.
Let us create one visual using MICROSOFT EXCEL.
We’ll do this using a standard procedure of importing the data into power bi.
It is also the solution for getting the data from EXCEL to POWER BI.
CREATING THE CONNECTION TO THE DATA SOURCE:
The first step is to create a connection to the data source.
For the example, we will take the data source as an EXCEL FILE, which is easily available for all the readers.
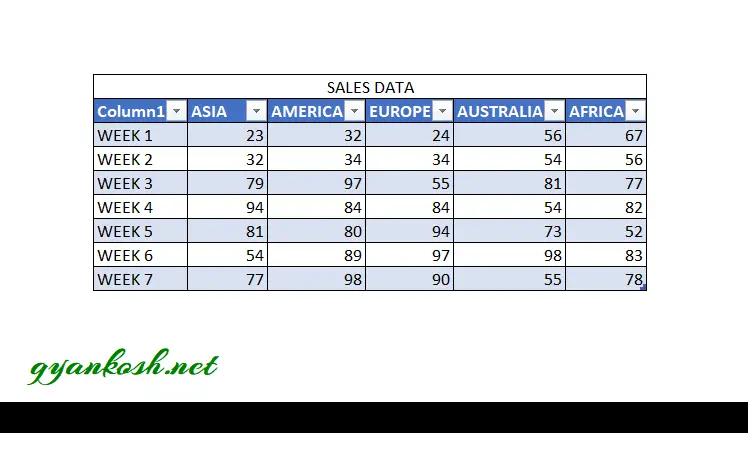
ALWAYS CREATE A TABLE IN EXCEL IF WE INTEND TO USE THE DATA IN POWER BI.
Let us create an excel file containing the following table. [The table can be copied easily]
| SALES DATA | |||||
| WEEK | ASIA | AMERICA | EUROPE | AUSTRALIA | AFRICA |
| WEEK 1 | 23 | 32 | 24 | 56 | 67 |
| WEEK 2 | 32 | 34 | 34 | 54 | 56 |
| WEEK 3 | 79 | 97 | 55 | 81 | 77 |
| WEEK 4 | 94 | 84 | 84 | 54 | 82 |
| WEEK 5 | 81 | 80 | 94 | 73 | 52 |
| WEEK 6 | 54 | 89 | 97 | 98 | 83 |
| WEEK 7 | 77 | 98 | 90 | 55 | 78 |
STEPS TO CREATE CONNECTION IN POWER BI:
- Click the POWER BI icon to execute the file and open POWER BI FOR DESKTOP.
- To create a connection with the Excel file, click on one of the following options.
- CLICK Excel directly from the DATA OPTIONS or go to GET DATA and choose EXCEL.
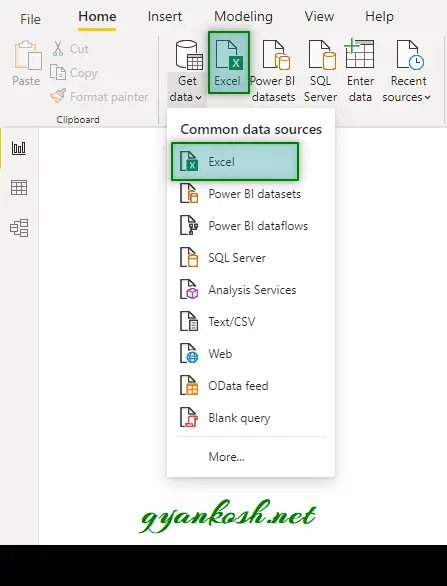
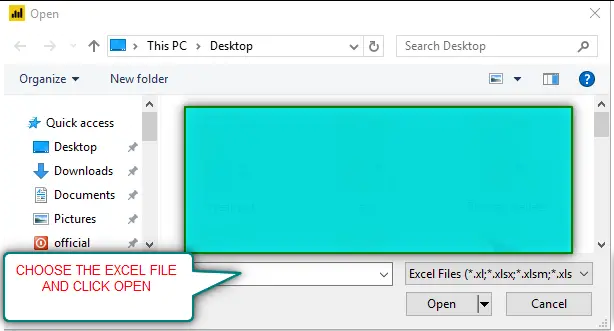
Just by clicking on the EXCEL OPTION, FILE OPENING DIALOG BOX, will open directly.
- Select the file, which we want to get the data from, and click open.
- After the file has been selected, POWER BI will scan the file for all the data and the following screen will follow.
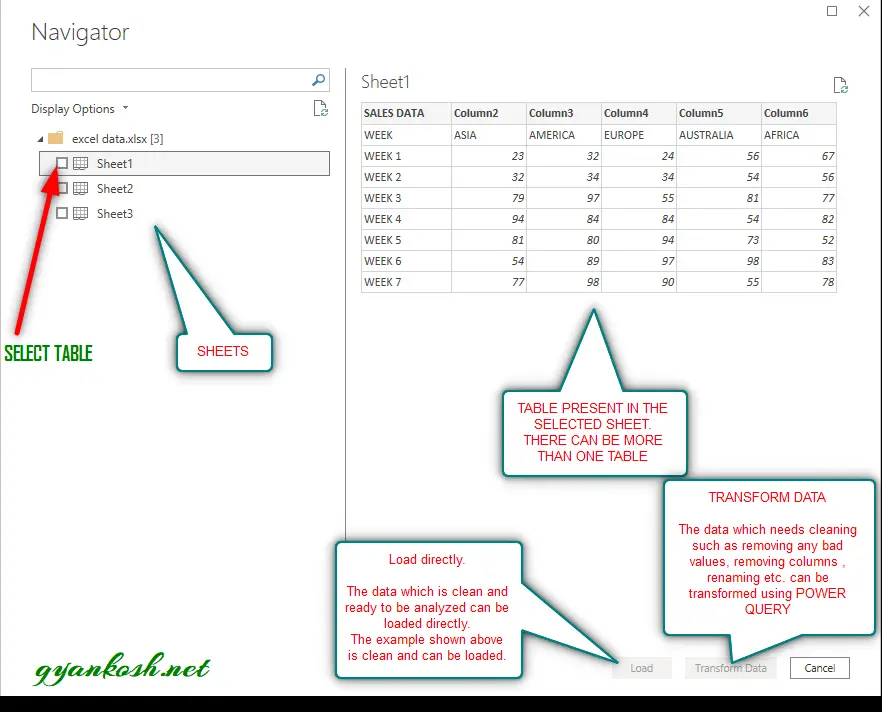
ONCE THE DATA COMES TO THE NAVIGATOR, THE CONNECTION IS FORMED.
The NAVIGATOR gives the option for the data selection.
Power bi will scan our EXCEL FILE and enlist the complete data which can be imported.
Let us understand the navigator.
On the left side are the Sheets.
We select the sheet and on the right pane, it’ll show the data present in the sheet.
We have only one table which is being shown. If more than one table, under the SHEET OPTION, the table options will appear which we can select and checkout the data before we import it.
For loading the data, select the table or tables by checking the checkbox on the left pane and click LOAD [If the data is ready and clean] or TRANSFORM DATA [If the data needs cleaning] through POWER QUERY.
If we click TRANSFORM DATA, it’ll open in POWER QUERY.
- For our example, the data is clean so we click LOAD.
FOR THE SERVICES OPTIONS, THE SERVICES WOULD ASK FOR AUTHENTICATION WITH YOUR USERNAME AND PASSWORD. ONCE DONE, IT’LL CREATE THE CONNECTION WITH THAT SERVICE AND FETCH THE DATA AVAILABLE.
ONCE THE DATA COMES TO THE NAVIGATOR, THE CONNECTION IS FORMED.
CREATING THE CONNECTION TO THE DATA SOURCE:
The NAVIGATOR gives the option for data selection.
Power bi will scan our EXCEL FILE and enlist the complete data which can be imported.
Let us understand the navigator.
On the left side are the Sheets. We select the sheet and on the right pane, it’ll show the data present in the sheet.
We have only one table which is being shown. If more than one table, under the SHEET OPTION, the table options will appear which we can select and checkout the data before we import it.
For loading the data, select the table or tables by checking the checkbox on the left pane and click LOAD [If the data is ready and clean] or TRANSFORM DATA [If the data needs cleaning] through POWER QUERY.
If we click TRANSFORM DATA, it’ll open in POWER QUERY.
- For our example, the data is clean so we click LOAD.
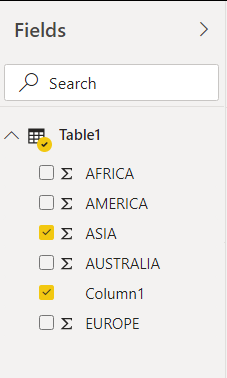
After we click load, the data would be imported into POWER BI and the table would enter the POWER BI as the fields in the right portion of the screen as shown in the picture below.

The fields have been populated in the POWER BI.
Now we can choose the fields and create any visuals. Let us choose the sales data of Asia.
For choosing the sales data of Asia we need to check COLUMN1 and ASIA [The names of the column can be changed easily using RIGHT CLICK> EDIT QUERY ]
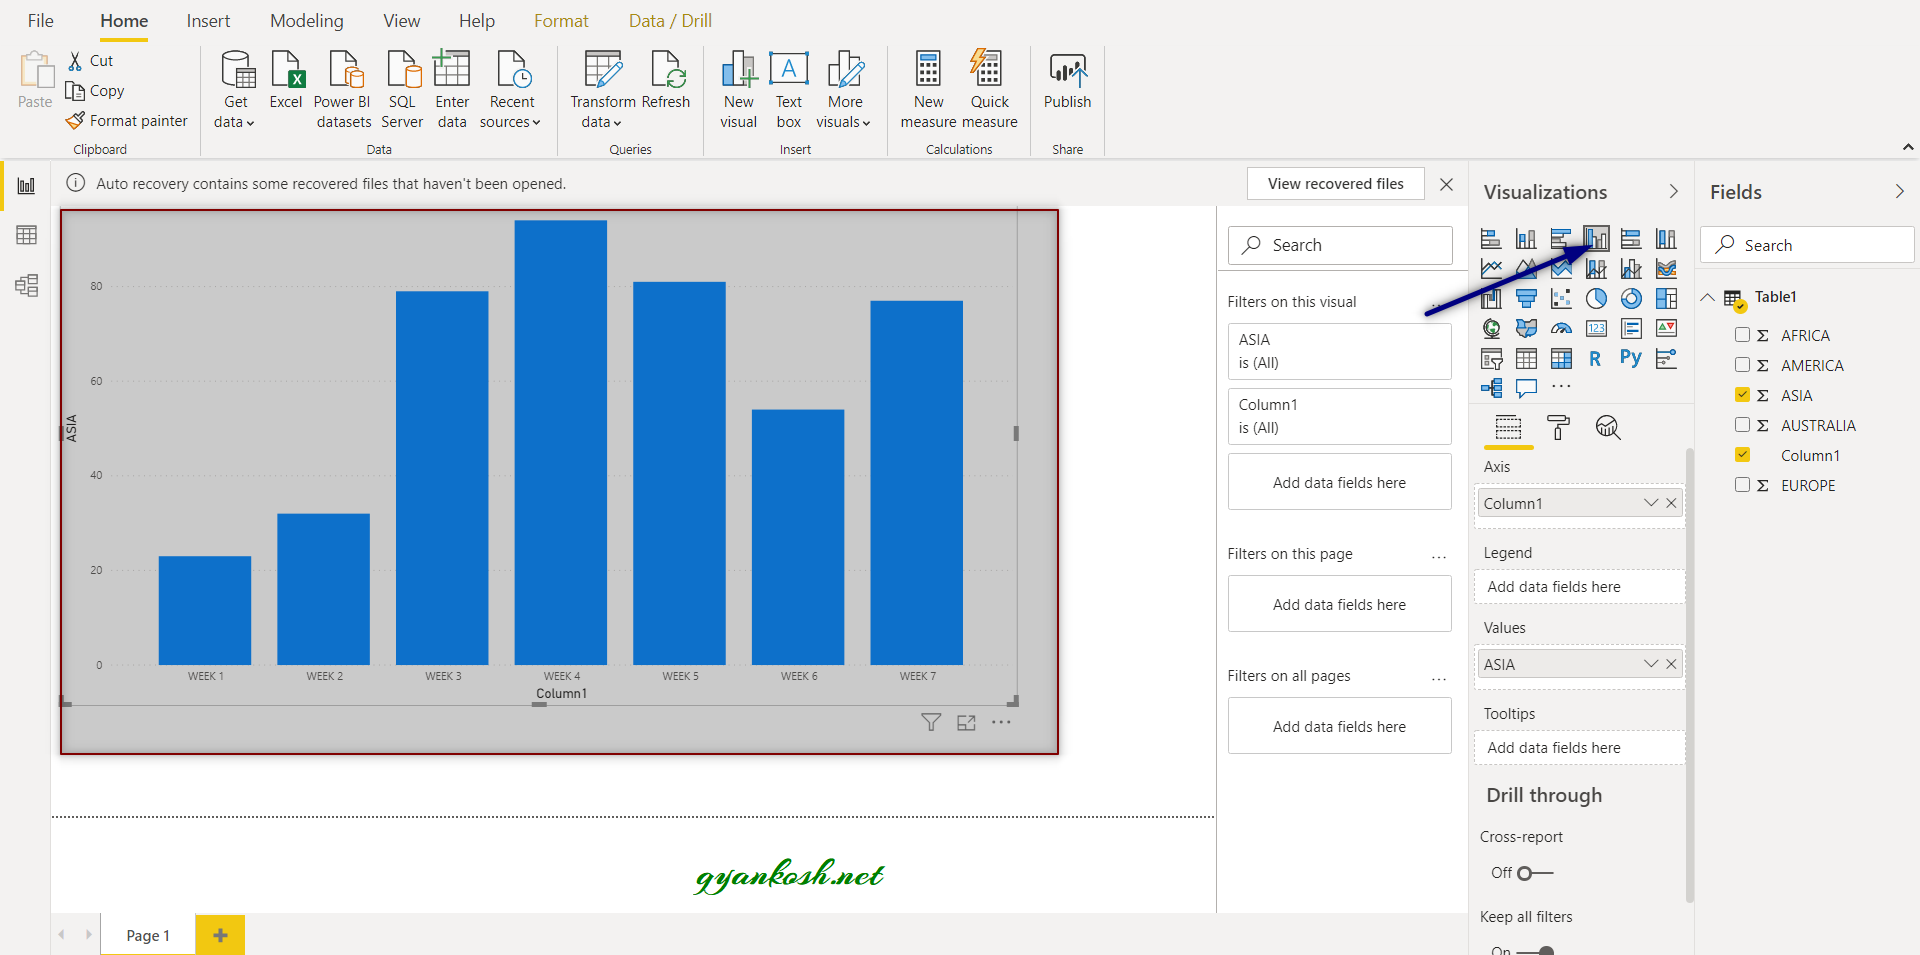
Choose the desired visual. Let us create the clustered visual. The location of the clustered column chart is shown in the picture below.
FIRST VISUAL IN POWER BI IS READY.
THE PROCEDURE WE JUST DISCUSSED IS THE STANDARD PROCEDURE OF CREATING A CONNECTION AND ADDING OR IMPORTING DATA TO POWER BI.
In this article, we learnt about data sources in Power BI.
