INTRODUCTION
POWER BI is a data analysis tool [ Software] which can help us to analyze the data in the lightening speed.
As the complexities of the businesses are increasing day by day, so is the number of data from various inputs, which are required to make the correct business decisions. In such a VOCA world, we can’t rely on any one or two inputs .
So, for such a scenario , we are in requirement of such a tool which can help us to get the data from various sources and analyze it in realtime.
The solution is POWER BI.
POWER BI has the options of cleaning the data immediately, visualizing it through various kinds of charts and publishing it [ sending ] through the online channel to various users which can use the reports for their business decisions.
THE POWER BI TOOL IS KIND OF A ANALYSIS CENTER WHERE THE DATA COMES THROUGH THE CONNECTIONS FROM VARIOUS SOURCES WHICH CAN BE A DATA BASE, EXCEL FILE, WEB AND N TYPE OF OTHER OPTIONS, DATA IS CLEANED, THE VISUALIZATIONS OR DASHBOARDS ARE MADE FOR THE ANALYSIS AND THE REPORT IS SHARED THROUGH OUTPUT TO POWER BI SERVICE WHICH CAN BE USED BY N USERS THROUGH MOBILE OR DESKTOP.
In this article we would go through the introduction of the POWER BI tool, its parts, its installation and its familiarization to the new users.
PARTS OF POWER BI
POWER BI system can be divided mainly into three parts.
- POWER BI DESKTOP APPLICATION
- POWER BI SERVICE
- POWER BI APPS
BRIEF DESCRIPTION:
- POWER BI DESKTOP APPLICATION- A desktop application for creating the power bi reports. The platform is also available online.
- POWER BI SERVICE – This is the service through which we can share our report online.
- POWER BI APPS – The apps are available for different platforms which can read power bi reports for the decision making.
HOW TO GET POWER BI SOFTWARE
The great thing is that POWER BI is free to download for the WINDOWS 10.
It can be downloaded from the official page of POWER BI.
Here is the direct link to download POWER BI for DESKTOP.
or
DOWNLOAD FROM WINDOWS STORE AS APP [ WINDOWS STORE WILL OPEN WITH POWER BI DOWNLOAD LINK]
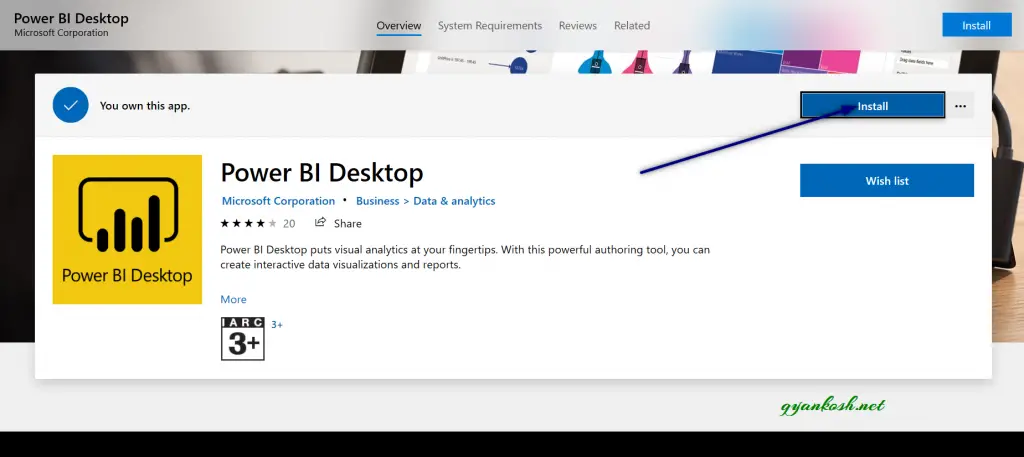
STEPS TO INSTALL POWER BI FOR DESKTOP:
- Click one of the links mentioned above.
- The download will start and saved in the placed selected by you.
- Double click the set up file.
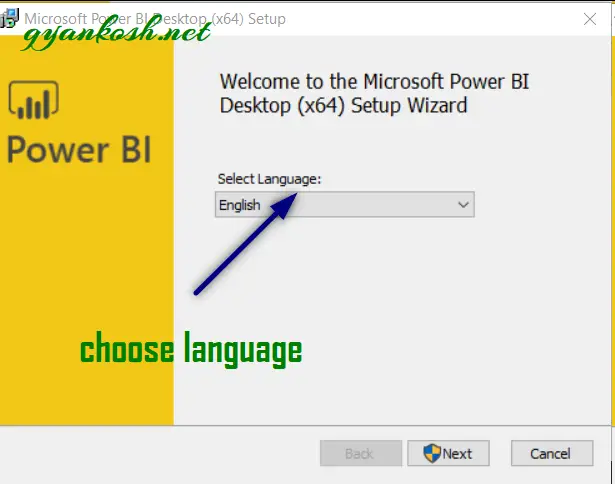
- It may ask if you want to run the set up file or not because it was download from the internet. CLICK RUN. The set up process will start.
- Choose the language as per requirement. Click NEXT.
- A message will appear ” An app wants to make changes to your computer” Click OK.
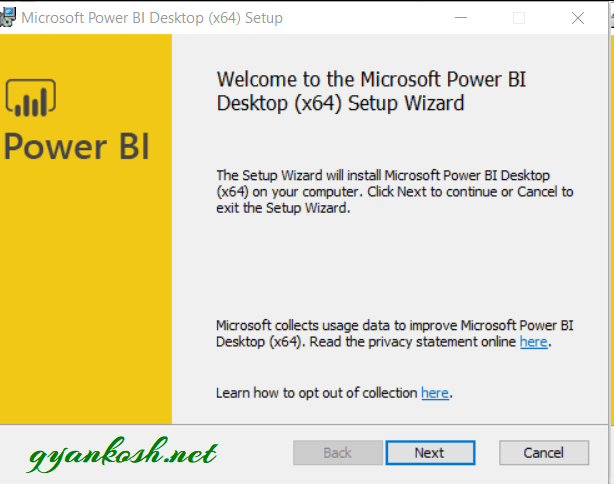
- The following screen will appear.
- Click NEXT.
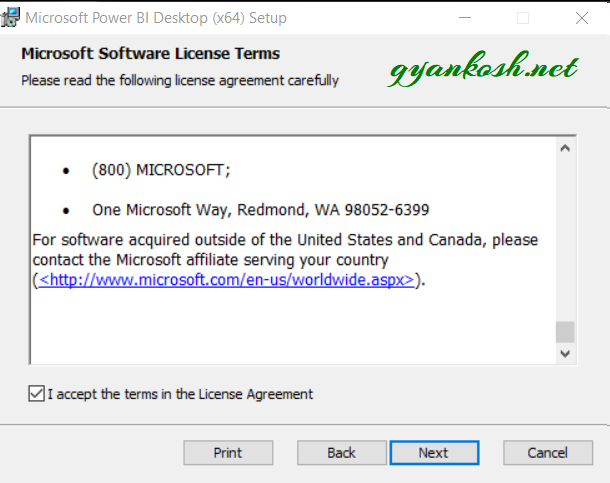
- The terms and conditions page will appear.
- Read the terms and conditions and check the box [I accept the terms in the License Agreement].
- Click NEXT.
- Choose the installation location. The default location will already comes filled. Change if you want to change.
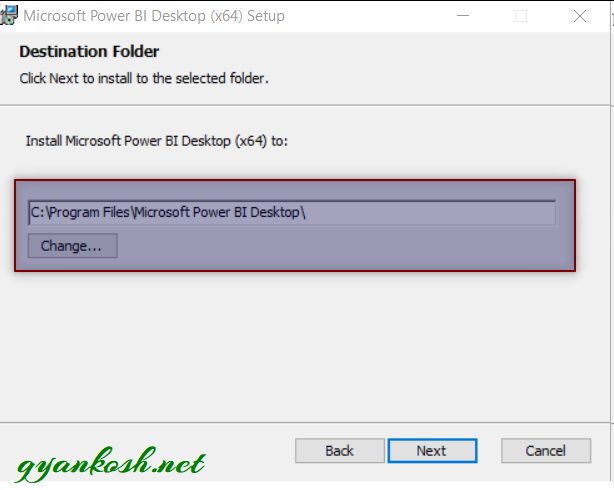
- In the next screen CLICK INSTALL.
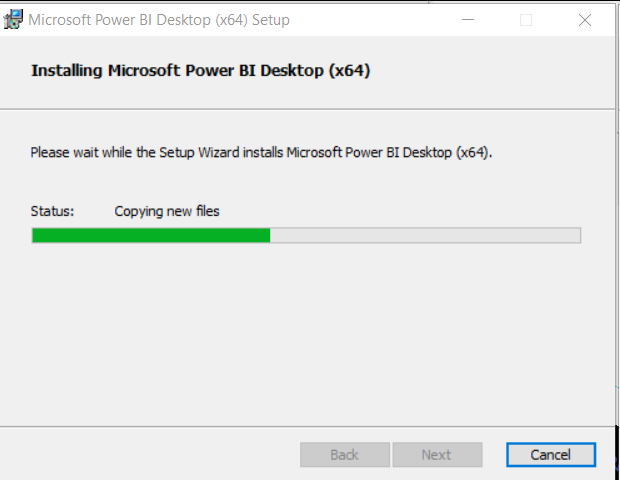
- The installation will start.
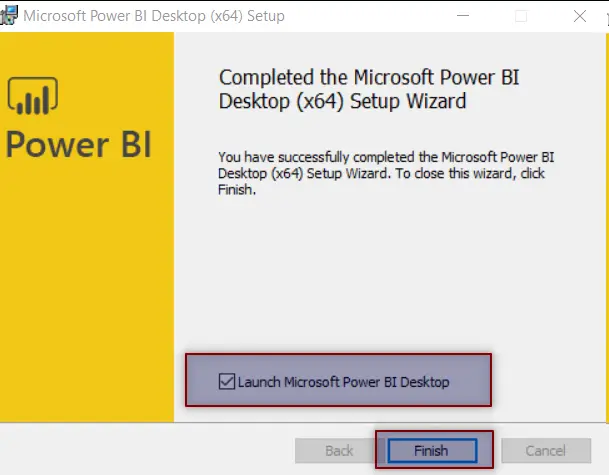
- Select the option LAUNCH MICROSOFT POWER BI DESKTOP and click FINISH.
- The software will run. Installation is finished.
“MACRO ARE THE AUTOMATED FUNCTIONS WHICH ARE PROGRAMMED IN VISUAL BASIC FOR APPLICATIONS.”
WORKING ENVIRONMENT OF POWER BI
After that we have successfully installed the POWER BI FOR DESKTOP.
Let us launch it and get acquainted with this software.
Double Click the icon of POWER BI FOR DESKTOP and launch it.
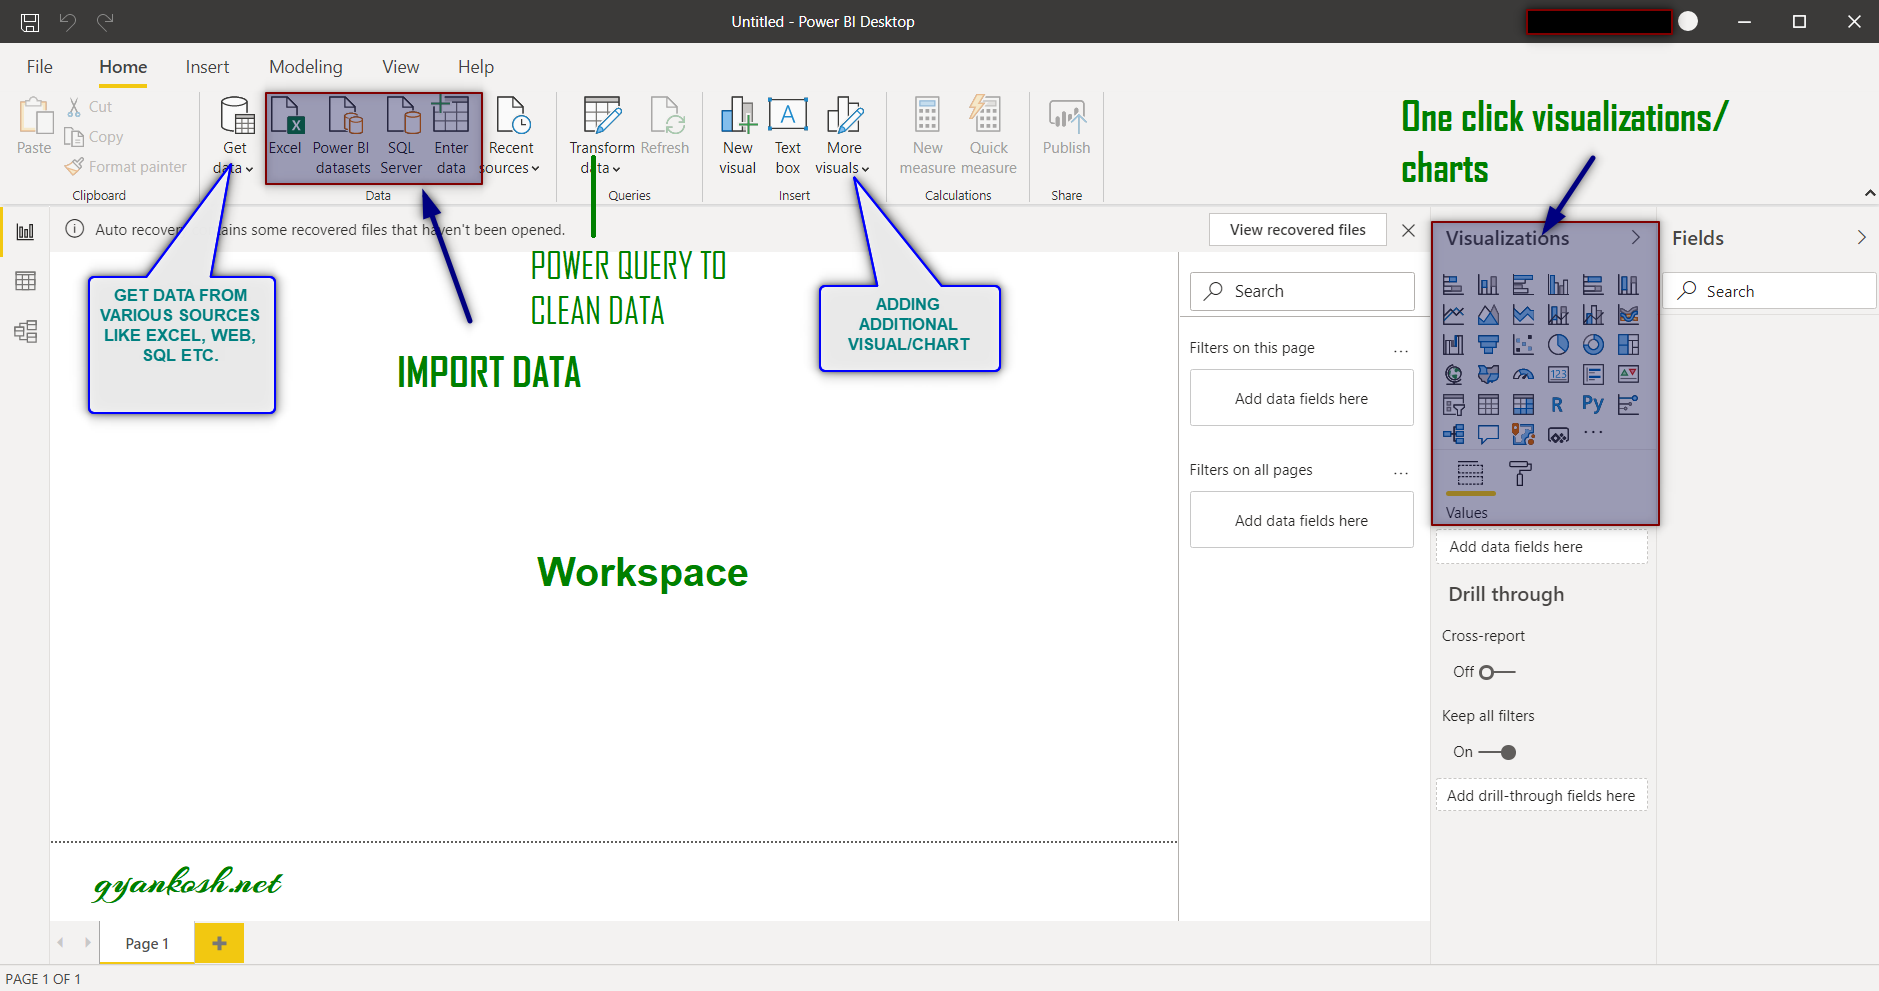
Here is the first screen of POWER BI.
A few of the important locations have been notified in the picture itself.
A brief introduction is here. [ Although the complete details will be provided once we start working on power bi ].
GET DATA: provides the various options of getting the data such as Excel, Sql server, web, Power bi data sets, CSV etc.
TRANSFORM DATA: Opens the data into the POWER QUERY ENVIRONMENT for the cleaning purpose.
CLEANING THE DATA simply means but not limited to REMOVE THE BAD CHARACTERS [When we copy unknowingly some hidden characters can enter our data which creates problem while working ] , NULL VALUES, EMPTY VALUES, CHANGING THE DATA TYPE , REMOVING THE DATA WHICH IS NOT NEEDED ETC.
POWER QUERY [ will be discussed in later articles ] is a transforming tool which helps us to perform all the above mentioned tasks very efficiently and in lightening speed.
ONE CLICK VISUALIZATIONS/CHARTS: Power BI is all about creating smart visuals which shows the different parameters of the business on the basis of which we take further decisions.
POWER BI provides an exhaustive list of visual types [ charts] which we can use in just one click.
WORKSPACE: Central area is the workspace where we create our visuals. FIELDS: In the picture below, the FIELDS to the extreme right contains the fields of the data which we have imported . [ Fields are not visible right now ].
IMPORTANT TERMS IN POWER BI
It is always very important we get to know the essential theory before we start our first project in POWER BI.
In the continuation, let us understand a few terms which are going to be used a lot while we learn to use POWER BI.
POWER BI is not a very big software but whatever it does is quite awesome and it makes our job quite easy especially creating the visual reports. Let us get acquainted with some terms which are quite important.
DATASET– It is simply the data behind the visualization or chart or map . The data can be a table which is taken from the simple excel file, or it can be database table or it can be a collection of the data being fetched from various resources.
Let us enlist a few important points about the datasets.
- It can be a static table from the Excel.
- It can be a combination of various fields where each field comes from the different source such as Excel, database or web.
- The visualization or chart or map is created on the basis of the dataset.
- After the data has been brought into the POWER BI, it’ll be treated as single dataset.
VISUALIZATION- Visualizations are the visual aids which help us to make wise business decisions. These can be CHARTS, MAPS or any other visual aid.
- It can be a chart, color map or any other visualization.
- The new options keep coming time to time. We need to update the software.
REPORTS : Report is a collection of the different visualizations. After we have created the visuals, we arrange them as a report.
- A report is a collection of visuals or charts.
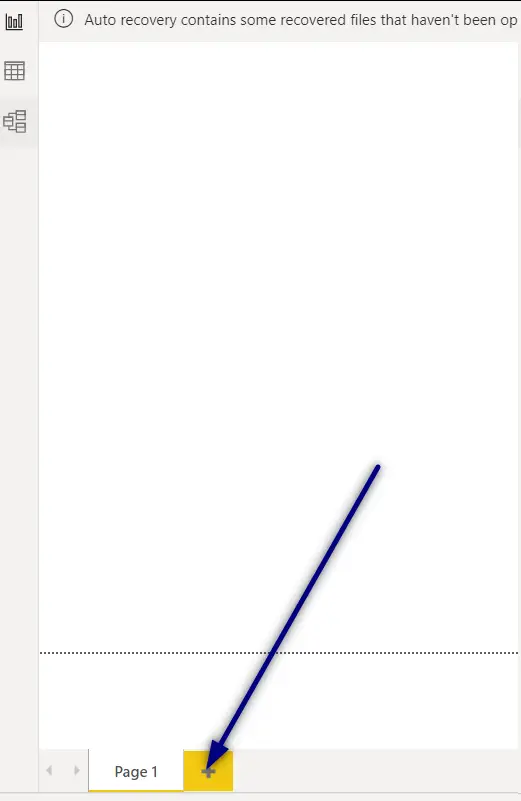
- It can be single page or multipage.
- Visuals can be arranged as per choice.
- As many visuals as we want can be created.
- The pages act as the TABS in the lower portion of the SOFTWARE.
TILES: A single visual is called as TILE. Actually our report is just a collection of many visuals called TILES.
- A single visualization is called a Tile.
- A Tile can be resized as per requirement by the creator.
- The tiles can be moved easily.
DASHBOARDS:Dashboards are a single page representation of the chosen visuals or graphics which convey the information as per the requirements. It can be shared using the power bi service[ The service to share the and can be used by many to get the required information.
- Dashboard is a group of important visuals.
- Fits on a single page called Canvas.
- Can be shared for information dissemination.
WE ARE GETTING THE RELEVANT DATA FROM THE VARIOUS SOURCES, FILTERING THE USEFUL DATA, CREATING VISUALIZATIONS AND SHARING THE DASHBOARDS AND REPORTS IN POWER BI.
POWER BI SERVICE
Out of the three parts of POWER BI SYSTEM which were POWER BI for desktop, POWER BI service and POWER BI APPS, we’ll focus now on the POWER BI SERVICE.
POWER BI service is the online portion of power bi cluster which publishes our report and make it visible to other power bi consumers [ users ].
But in addition to this, it has apps too. Apps are ready to use power bi dashboards which we can download and use for our reporting.
POWER BI SERVICES is just like an account which needs to be signed up and only after that we can make use of this.
APPS IN POWER BI SERVICE ARE THE SIMPLE READY TO USE DASHBOARDS. JUST PUT THE DATA AND THE DASHBOARDS ARE READY TO GO.
SIGNING UP POWER BI SERVICE.:
The signing up is easy and step wise step process.
CLICK HERE TO SIGN UP FOR POWER BI SERVICE ACCOUNT.
Follow the step wise step process to sign up for the POWER BI SERVICE.
Although the process is quite simple and self elanatory,
A few important points are here while signing up:
- Consumer email services like gmail, yahoo etc. mails won’t be accepted. Only professional or work mails will be accepted.
- Pro service is given a 60 days trial. [ only for POWER BI service].
- Rest the process is easy to follow.
After we have signed in, we come to a account kind of environment as shown below.
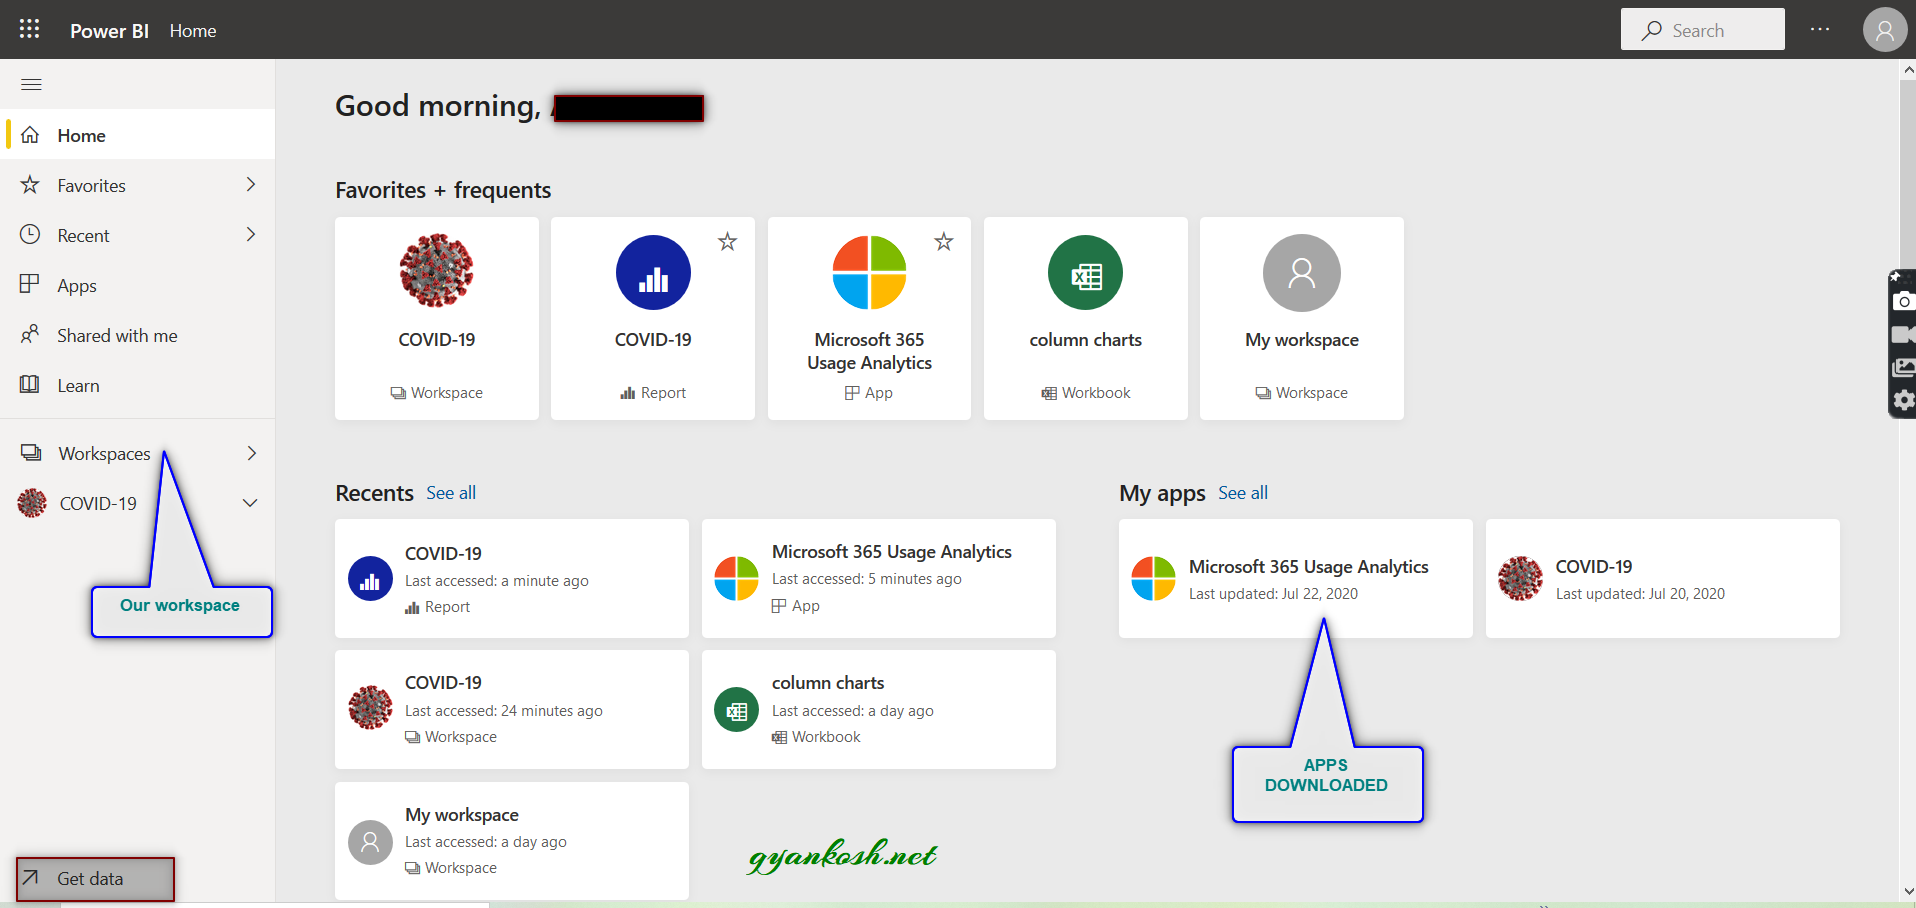
Summarizing the POWER BI SERVICE tool,
- It is simply a report publishing and sharing tool.
- We can install our dashboards in this service and use it.
- Once published, we are able to share this report to multiple platforms like teams, power bi mobile, through email etc.
- The reports are accessible through our account from anywhere on the internet.
POWER BI MOBILE APPS
The third part of the POWER BI CLUSTER is the POWER BI MOBILE APPS.
We can download the mobile apps from the APP STORE.
FOLLOW THE STEPS TO DOWNLOAD POWER BI MOBILE APP IN ANDROID.
[CLICK HERE TO DOWNLOAD POWER BI FOR ANDROID]
or

Summarizing the POWER BI SERVICE tool,
- It is simply a report publishing and sharing tool.
- We can install our dashboards in this service and use it.
- Once published, we are able to share this report to multiple platforms like teams, power bi mobile, through email etc.
- The reports are accessible through our account from anywhere on the internet.