INTRODUCTION
POWER BI is a data analysis tool [ Software] which can help us to analyze the data in the lightening speed.
CLICK HERE TO LEARN THE BASICS OF POWER BI
We already learnt the basic procedure of importing data into POWER BI through an example taken for the
insertion of data from the EXCEL FILE , MS SQL SERVER and MICROSOFT ACCESS into the POWER BI.
Now we will learn to import the data from a csv file, which has become quite popular these days.
In this article , we would fetch the data from a csv file and create a visual.
WHAT IS A CSV FILE?
CSV stands for COMMA SEPARATED VALUES.
It is a plain text file which has the content delimited by commas.
The records are presented in a line. Normally one line contains one record which is separated by a comma.
The fields are separated by commas.
The name is due to the use of the COMMA AS A SEPARATOR.
CSV can also contain semicolons, yet it would work as csv file. (European Countries use semicolon (;) in place of a comma (,)
The file has the extension as ” .csv “.
PROCEDURE OF IMPORTING DATA TO POWER BI FROM CSV FILE
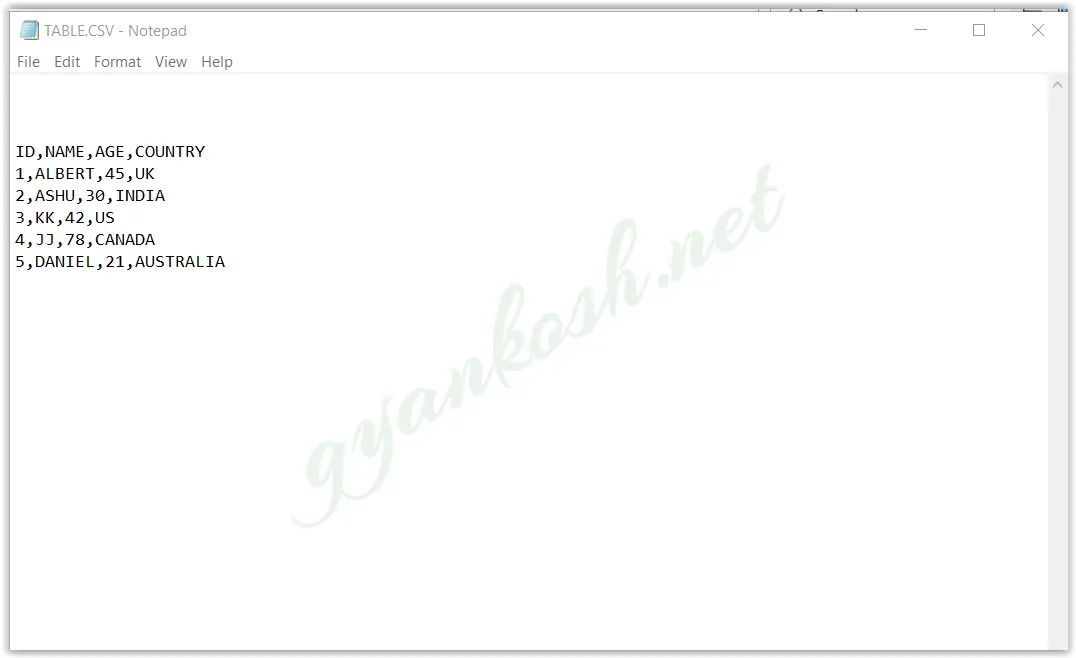
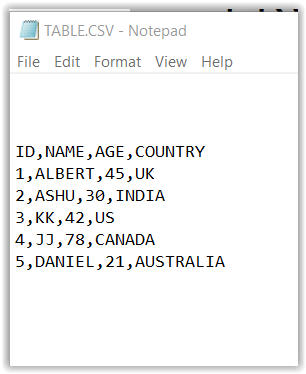
We have already discussed briefly about the CSV file.Let us check the data which we intend to import.
The structure of the table is shown in the picture below.
CREATING THE CONNECTION TO THE DATA SOURCE:
THE FIRST STEP IS TO CREATE CONNECTION IN POWER BI.
STEPS TO CREATE CONNECTION IN POWER BI:
- Click the POWER BI icon to execute the file and open POWER BI FOR DESKTOP.
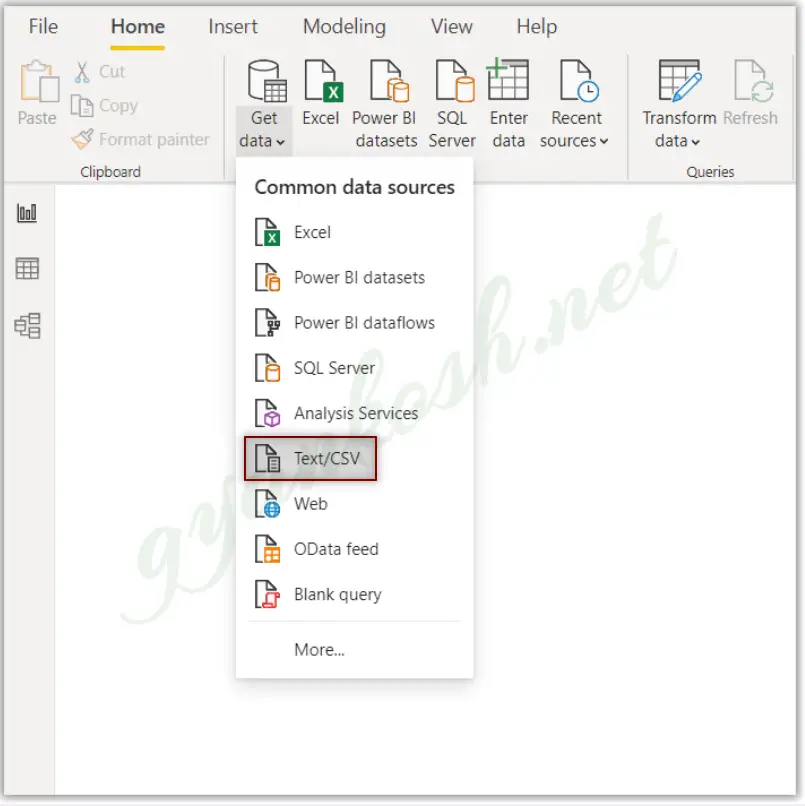
- To create a connection with the CSV FILE, click on GET DATA button.
- In the drop down menu choose TEXT/CSV, a new windows will open as shown in the picture below.
- After clicking the ACCESS DATABASE, the OPEN FILE DIALOG BOX will open.
- Choose the CSV FILE from the location where it is kept.
- CLICK OK.
- The connection will be created and the data would be shown for the selection in the navigator.
IMPORTING THE DATA TO POWER BI:
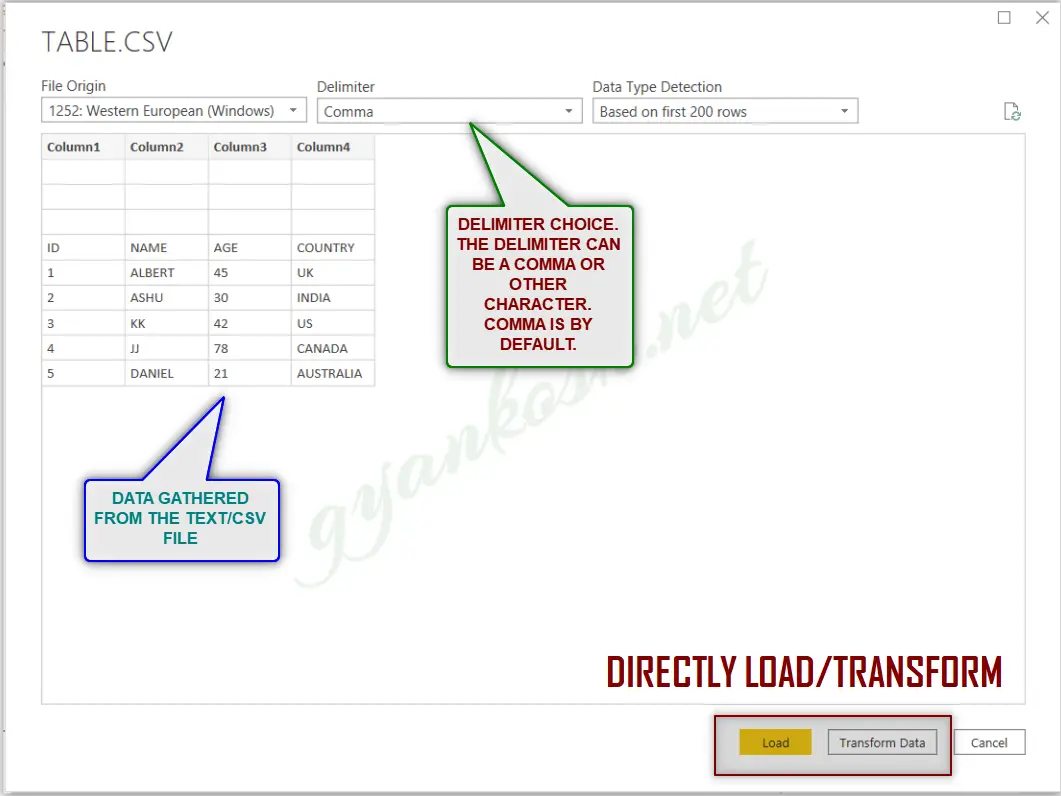
The NAVIGATOR will gather all the data and show it.
Let us understand the navigator.
LOOK AT THE PICTURE BELOW.
The data is available in the navigator.If the data is ready [ Clean ], it can be directly loaded by pressing LOAD , if not, and if we need to clean it up,
we can choose TRANSFORM DATA.
This time, as we brought the data from the CSV file, all the fields are TEXT, but the ID and AGE need to be in the NUMBER FORMAT, otherwise we’ll be having problem while creating visuals.
So we choose TRANSFORM DATA.
When we choose TRANSFORM DATA, the data opens up in the POWER QUERY EDITOR.
CLICK HERE TO LEARN THE DIFFERENT PROCEDURES IN POWER QUERY EDITOR.
Following picture shows the data as it loads in power query.
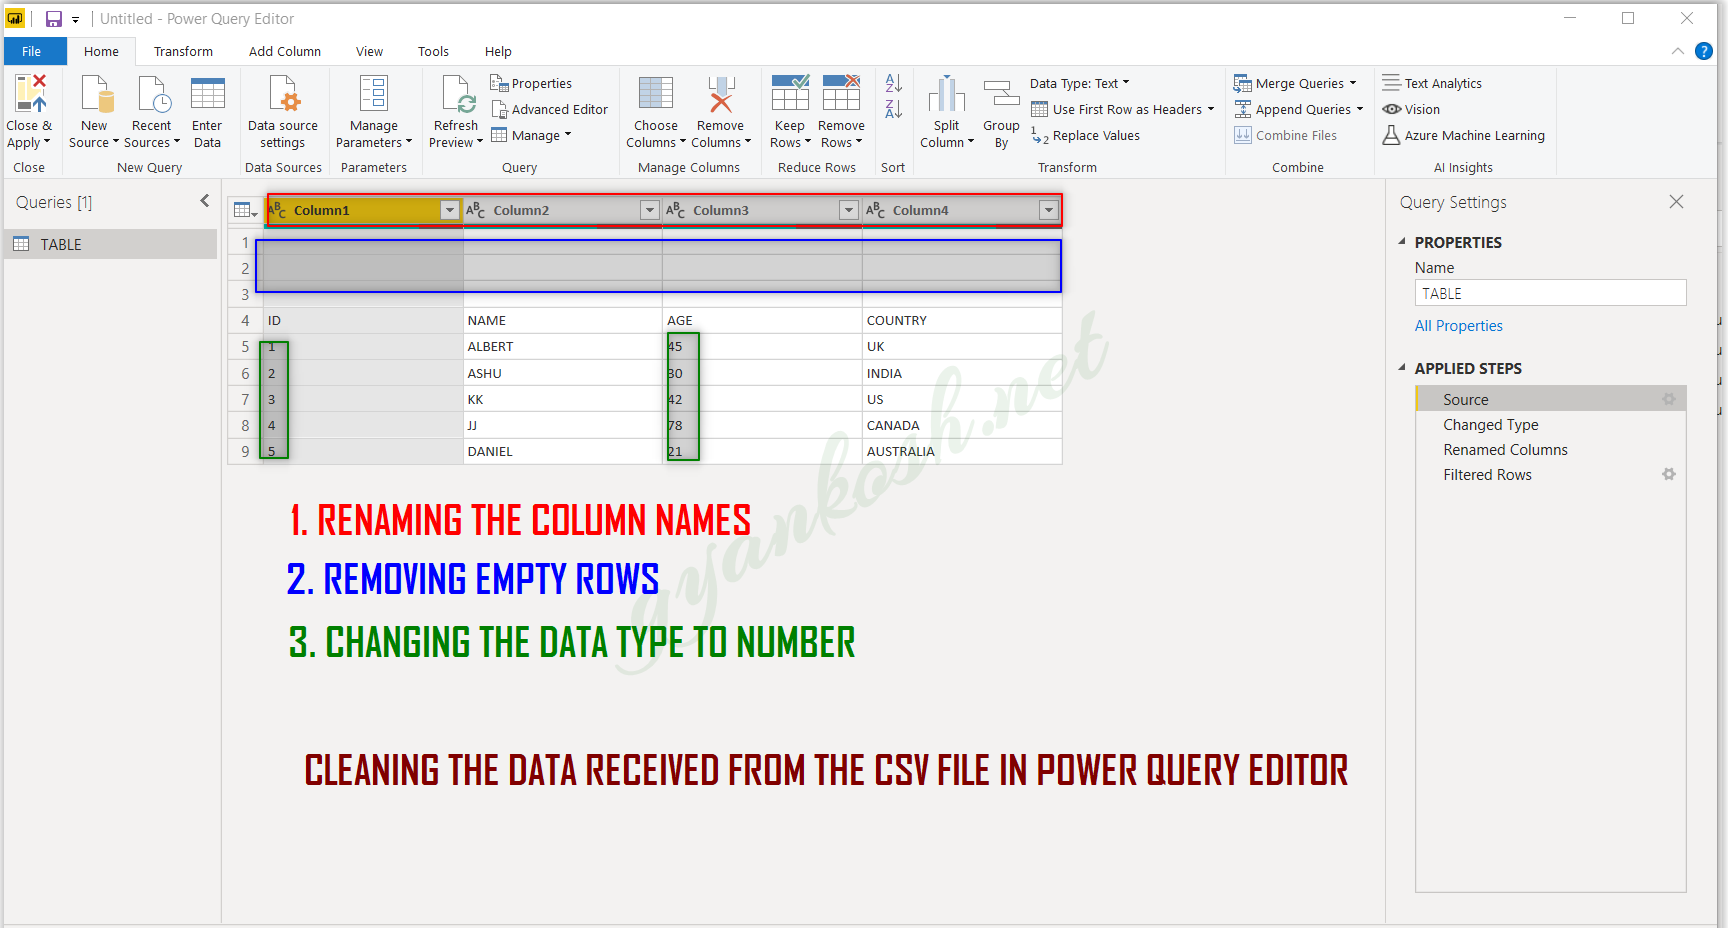
We have the following tasks in the data loaded into power query. [CLICK HERE FOR IN DEPTH DETAILS OF THE FOLLOWING OPERATIONS.]
1. Renaming the column names.:
Right click the column and click Rename. Choose the name as in the original table. Repeat the process for all the column names.
2. Removing the empty rows.
Click the arrow with the column names and deselect the blank , empty, column name [previous one as text] . It’ll remove them from the table. Do this process in the first column.
3. Changing the data types to number types.
Right click the column name, choose change type and choose WHOLE NUMBER. It’ll sort our purpose.
After all the steps are done, click CLOSE AND APPLY. The power query will close and the edited data will be loaded into power bi.
The data after cleaning looks like in the following picture.
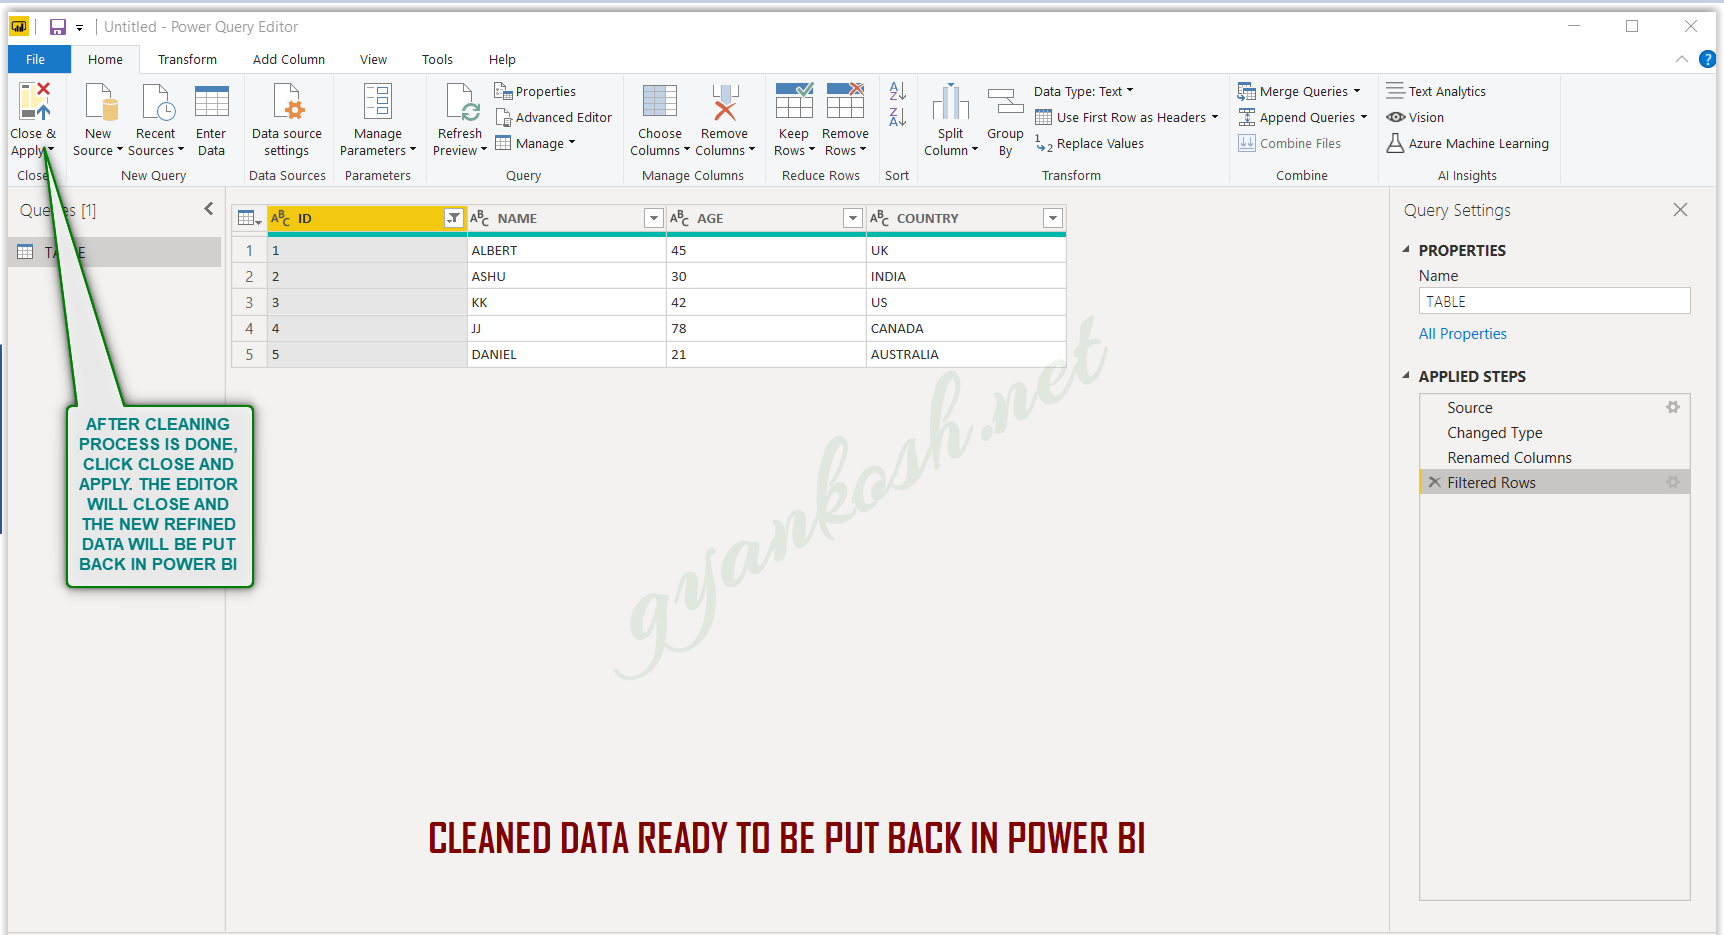
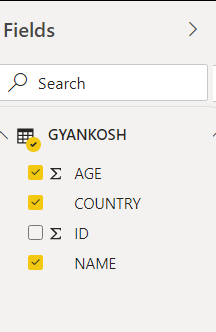
After we click CLOSE AND APPLY , the data would be imported into POWER BI and the table would enter the POWER BI as the fields in the right portion of the screen as shown in the picture below.
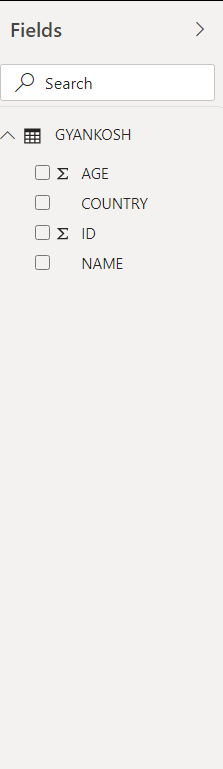
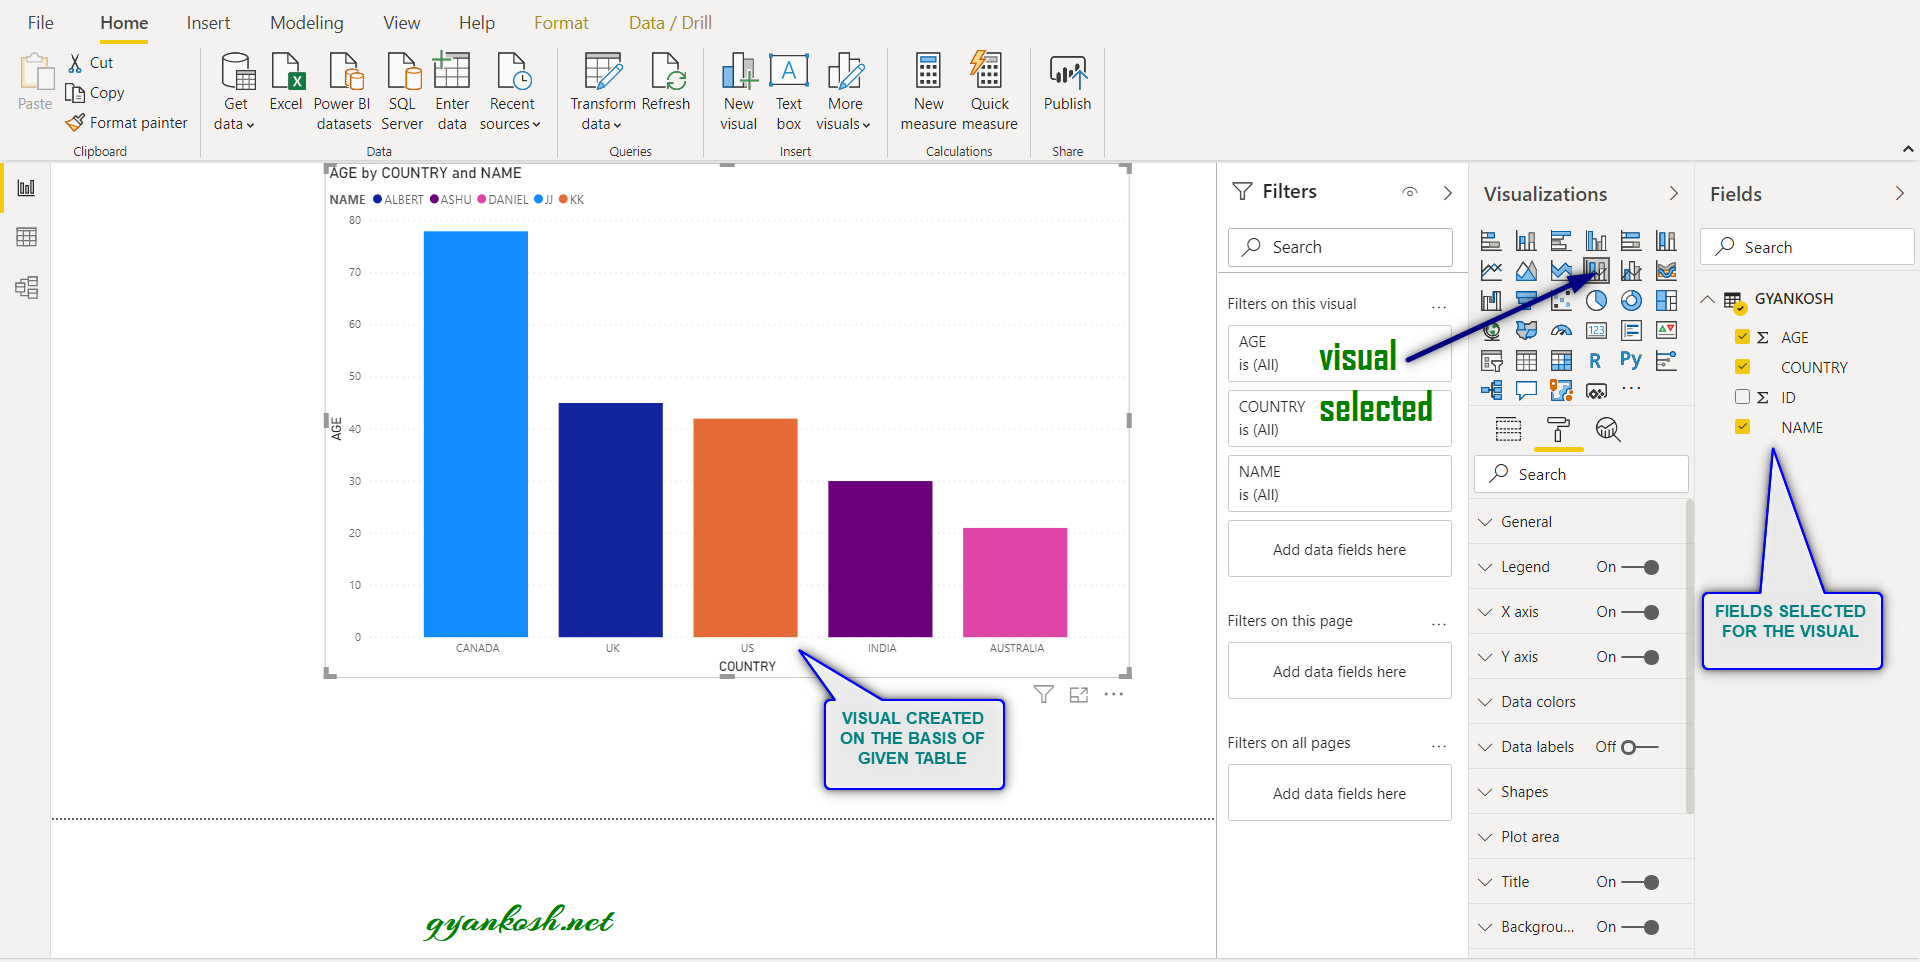
- The fields have been populated in the POWER BI. Now we can choose the fields which we want to include and create any visuals.
- Let us choose Age, country and Name fields.
- As soon as we choose the fields, a small table would start appearing in the CANVAS [Central area where visuals/charts appear ].
- Choose the desired visual. Let us create the Line and Stacked Column Chart or Stacked Column Chart.
- The location of the LINE AND STACKED COLUMN CHART is shown in the picture below. STACKED COLUMN CHART is second in the list. We haven’t specified the data for the LINE CHART so our chart behaves like STACKED COLUMN CHART only.
- The visual is ready. [LOOK AT THE PICTURE BELOW FOR REFERENCE]