Table of Contents
- INTRODUCTION
- PROCEDURE TO IMPORT DATA FROM OTHER DATABASE IN POWER BI [MICROSOFT ACCESS]
- PROCEDURE OF IMPORTING DATA TO POWER BI FROM SQL SERVER
- POINTS TO REMEMBER WHILE FETCHING THE DATA FROM SQL SERVER TO POWER BI
INTRODUCTION
POWER BI is a data analysis tool [ Software] which can help us to analyze the data in the lightening speed. In this article , we would learn the ways to import data from database in power bi with the examples of Microsoft Access and SQL Server.
CLICK HERE TO LEARN THE BASICS OF POWER BI
We already learnt the basic procedure of importing data into POWER BI through an example taken for the
insertion of data from the EXCEL FILE into the POWER BI.
One of the more common case is the importing of data from the databases into the power bi as a lot of data is kept
in the databases.
PROCEDURE TO IMPORT DATA FROM OTHER DATABASE IN POWER BI [MICROSOFT ACCESS]
Before we start the process, we need to have data in the ACCESS DATABASE.
We know that database contains the data in the form of TABLES. It can contain very large quantities of data.
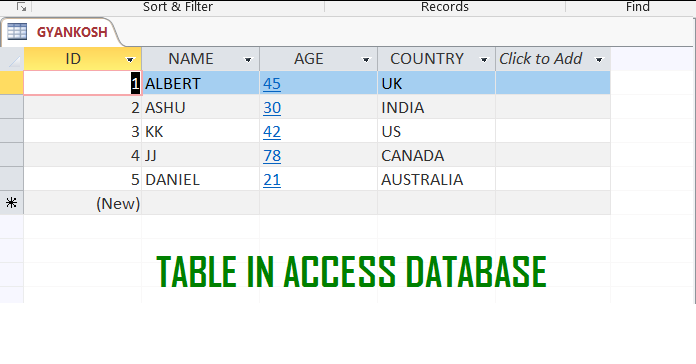
For the example, we will create a table in the ACCESS DATABASE.
The table contains the Name, age and country of five persons.
The structure of the table is shown in the picture below.
WE NEED TO HAVE MICROSOFT ACCESS DATABASE ENGINE BEFORE WE CAN USE IT IN POWER BI. IF YOU DON’T HAVE IT INSTALLED GET IT FROM HERE.
IT IS A SIMPLE INSTALLATION AND NO CONFIGURATION IS NEEDED. TAKE CARE THAT YOU INSTALL X32 IF WE HAVE POWER BI AND ACCESS OF X32 ARCHITECTURE AND X64 IF POWER BI AND ACCESS IS OF X64, OTHERWISE IT WON’T WORK PROPERLY.
CREATING THE CONNECTION TO THE DATA SOURCE:
THE FIRST STEP IS TO CREATE CONNECTION TO THE DATABASE.
STEPS TO CREATE CONNECTION TO DATABASE IN POWER BI:
- Click the POWER BI icon to execute the file and open POWER BI FOR DESKTOP.
- To create a connection with the ACCESS DATABASE, click on GET DATA button.
- In the drop down menu choose MORE, a new windows will open as shown in the picture below.
- Choose DATABASE from the left side and choose ACCESS DATABASE on the right options.
- Click CONNECT.

- After clicking the ACCESS DATABASE, the OPEN FILE DIALOG BOX will open.
- Choose the database file from the location where the database file is kept.
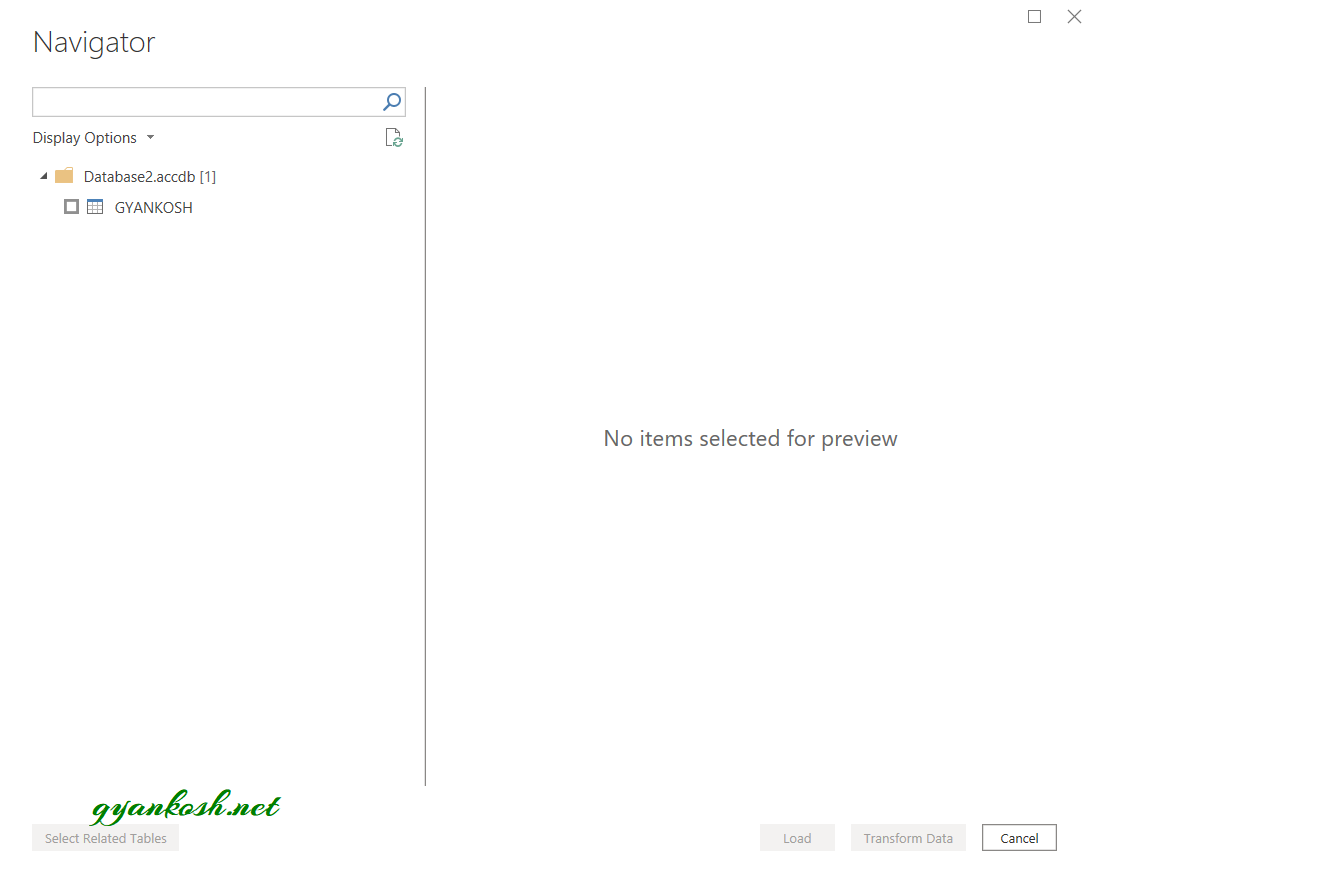
- If everything is fine, It’ll create a connection with the ACCESS DATABASE ENGINE and will open the tables available in the database in the NAVIGATOR as shown in picture below.
IMPORTING THE DATA INTO POWER BI:
The NAVIGATOR gives the options for the data selection.
Power bi will scan our ACCESS DATABASE FILE and find out all the tables available.
Let us understand the navigator.
LOOK AT THE PICTURE BELOW.
On the left side, the name of the database file selected is present.
Under the file, all the tables will be listed.
Currently we have one table named GYANKOSH.
For loading the data, select the table or tables by checking the checkbox on the left pane [GYANKOSH TABLE for our example ] and click LOAD [If the data is ready] or TRANSFORM DATA [If the data needs cleaning] through POWER QUERY.
If we click TRANSFORM DATA, it’ll open in POWER QUERY.
- For our example, the data is ready so we click LOAD.
After we click load, the data would be imported into POWER BI and the table would enter the POWER BI as the fields in the right portion of the screen as shown in the picture below.

- The fields have been populated in the POWER BI. Now we can choose the fields which we want to include and create any visuals.
- Let us choose Age, country and Name fields.
- As soon as we choose the fields, a small table would start appearing in the CANVAS [Central area where visuals/charts appear ].

- Choose the desired visual. Let us create the Line and Stacked Column Chart or Stacked Column Chart.
- The location of the LINE AND STACKED COLUMN CHART is shown in the picture below. STACKED COLUMN CHART is second in the list. We haven’t specified the data for the LINE CHART so our chart behaves like STACKED COLUMN CHART only.
- The visual is ready. [LOOK AT THE PICTURE BELOW FOR REFERENCE]

PROCEDURE OF IMPORTING DATA TO POWER BI FROM SQL SERVER
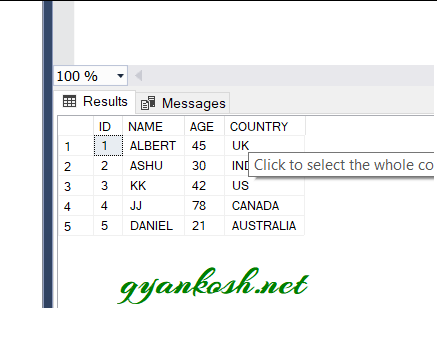
The process goes similar to the one we already discussed. We’ll briefly learn how to import data from SQL Server. We have created the same data in SQL Server.
CREATING THE CONNECTION TO THE DATA SOURCE:
THE FIRST STEP IS TO CREATE CONNECTION TO THE DATABASE.
STEPS TO CREATE CONNECTION TO DATABASE IN POWER BI:
- Click the POWER BI icon to execute the file and open POWER BI FOR DESKTOP.
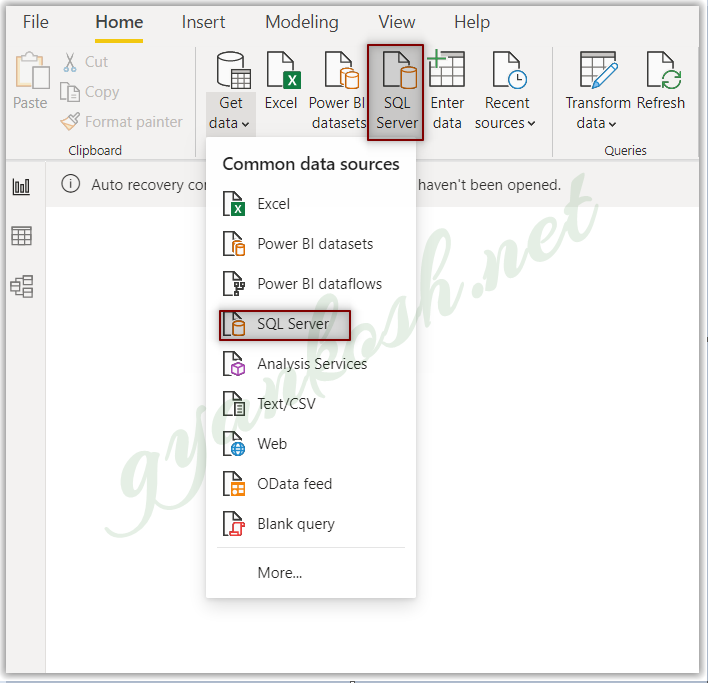
- To create a connection with the SQL SERVER, click on GET DATA button.
- In the drop down menu choose SQL SERVER, or we can directly choose the SQL SERVER option from the direct choices. [Both options are marked in the picture below ]
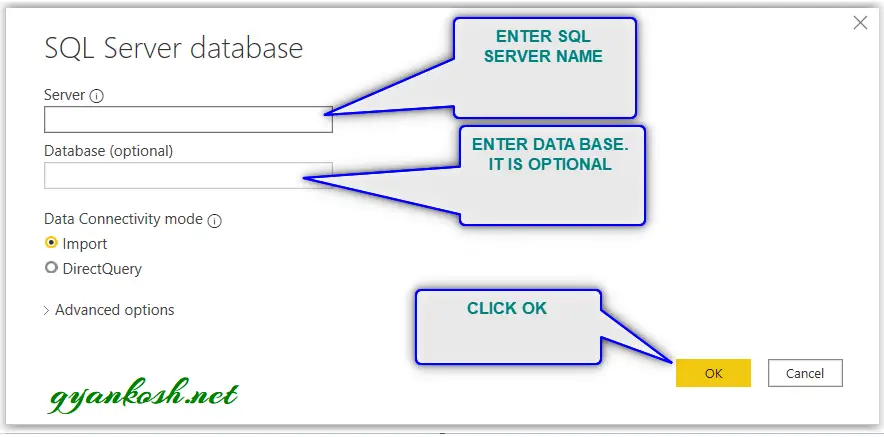
- After clicking the option for connecting SQL SERVER, a small window will open for the SQL SERVER details as shown in the picture below.
- In the first field named SERVER, enter the SQL SERVER NAME.
- In the next field named DATABASE, which is optional, you could give the database name.
- Click OK.
If everything goes fine [ Database engine is on, service is working properly] , the connection will be successfully made as shown in the picture below.
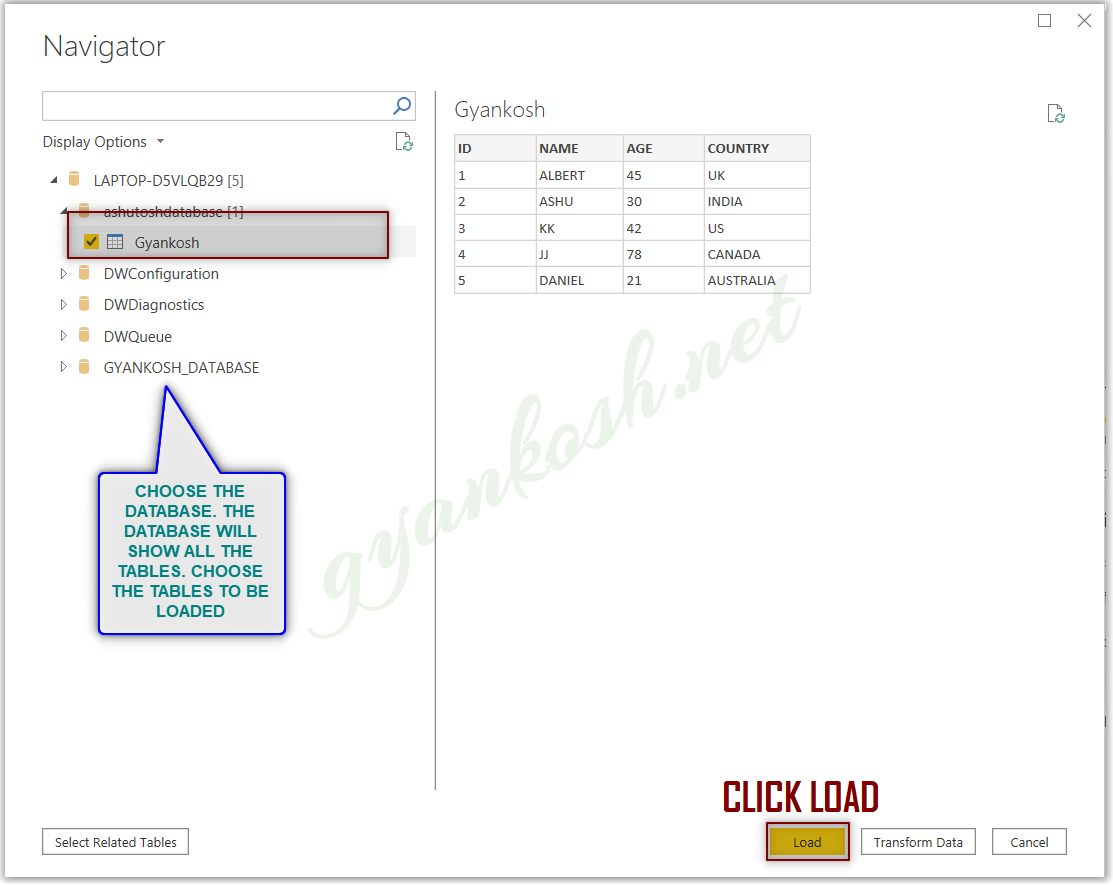
It’ll open the data in the navigator.
IMPORTING THE DATA INTO POWER BI:
The NAVIGATOR gives the options for the data selection.
Power bi will scan our ACCESS DATABASE FILE and find out all the tables available.
Let us understand the navigator.
LOOK AT THE PICTURE BELOW.
On the left side, the name of the database is present, under which is the complete list of databases.
Click the database under which the tables exists.
Choose the table to be loaded, click the checkbox.
Click LOAD [If the data is ready] or TRANSFORM DATA [If the data needs cleaning] through POWER QUERY.
If we click TRANSFORM DATA, it’ll open in POWER QUERY.
- For our example, the data is ready so we click LOAD.
After we click load, the data would be imported into POWER BI and the table would enter the POWER BI as the fields in the right portion of the screen as shown in the picture below.

- The fields have been populated in the POWER BI. Now we can choose the fields which we want to include and create any visuals.
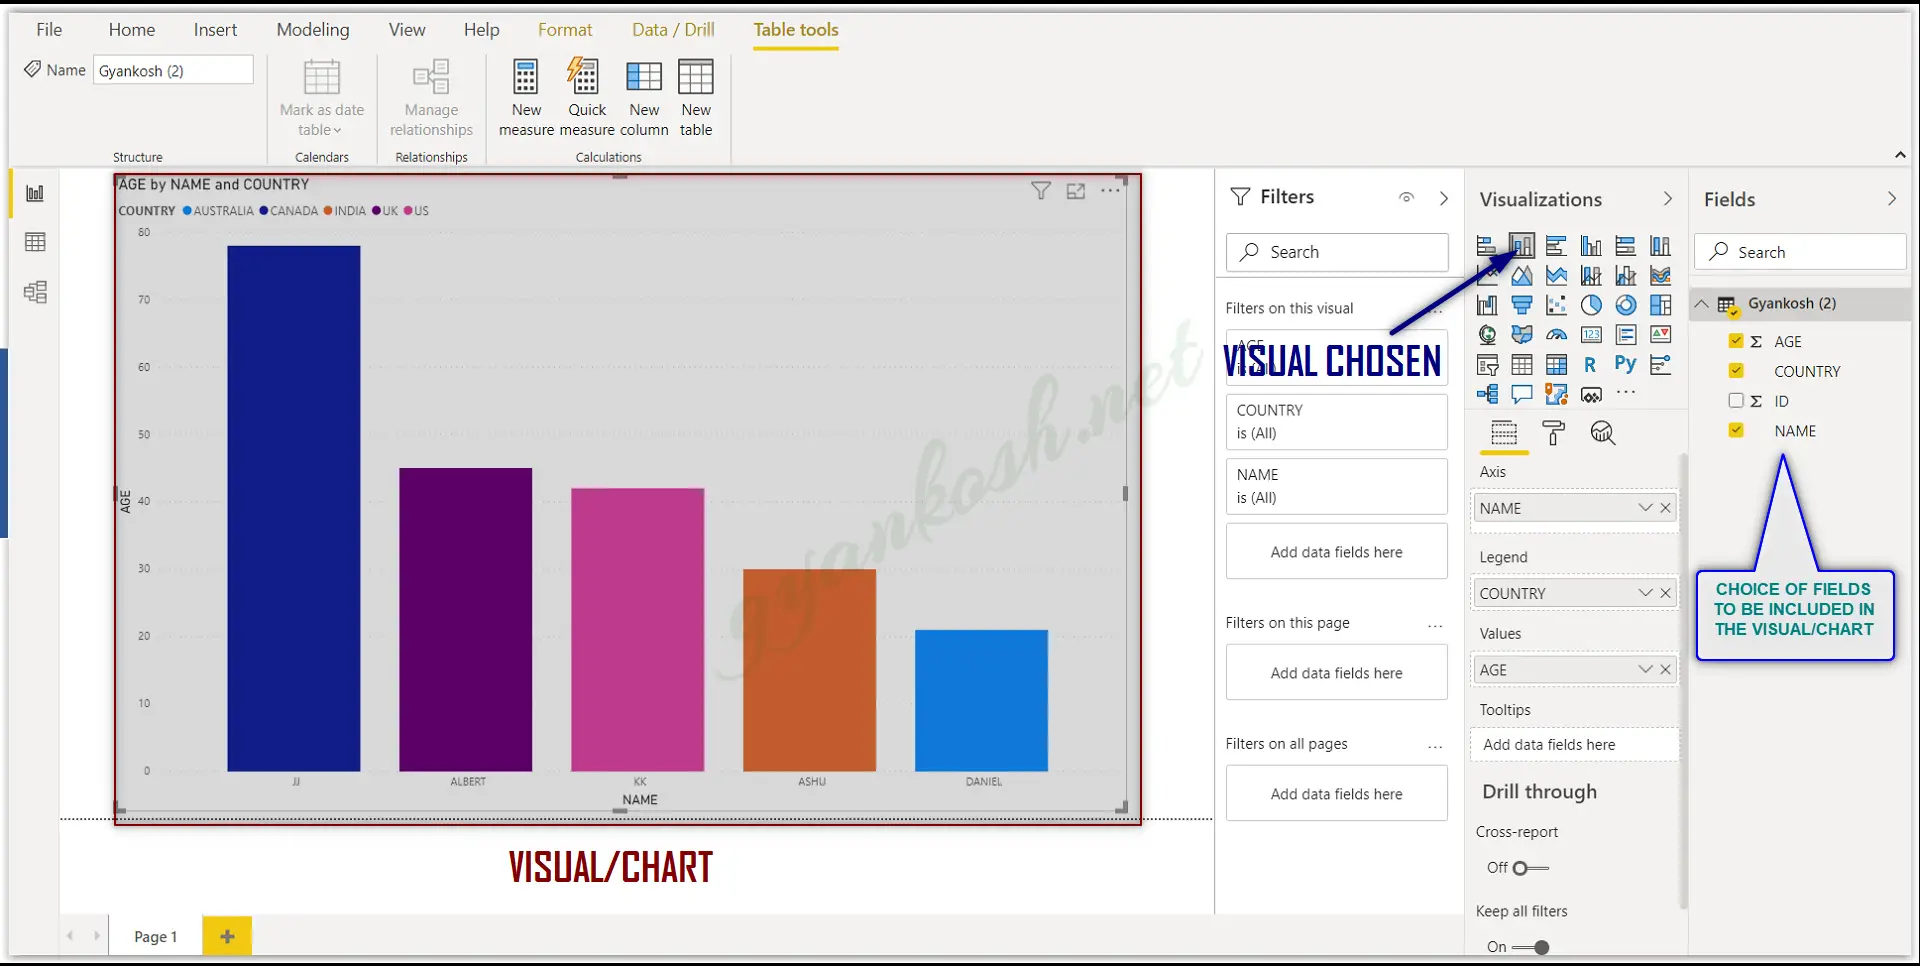
- Let us choose Age, country and Name fields.
- As soon as we choose the fields, a small table would start appearing in the CANVAS [Central area where visuals/charts appear ].

- Choose the desired visual. Let us create Stacked Column Chart.
- The location of the STACKED COLUMN CHART is shown in the picture below. STACKED COLUMN CHART is second in the list.
- The visual is ready. [LOOK AT THE PICTURE BELOW FOR REFERENCE]
POINTS TO REMEMBER WHILE FETCHING THE DATA FROM SQL SERVER TO POWER BI
- THE DATABASE ENGINE SERVICE SHOULD BE ON. IF IT IS STOPPED THE DATA WON’T BE FETCHED AND WOULD EARN AN ERROR.
- THE FORMAT OF THE COLUMNS OF THE TABLE IN THE SQL SERVER PLAYS MUCH IMPORTANT ROLE. THE NUMERICAL VALUES SHOULD BE NUMBER, AND TEXT SHOULD BE VARCHAR OR TEXT. WHEN FETCHED IN THE POWER BI, IF THE NUMBERS ARE STORED AS TEXT, IT WON’T CREATE A VISUAL AND YIELD AN ERROR.
- IF THE DATA IS NOT AS PER DESIRED, WE CAN ALWAYS EDIT IT IN POWER QUERY [DISCUSSED SEPARATELY ].