Table of Contents
- INTRODUCTION
- WHEN TO USE TREEMAP CHARTS ?
- BUTTON LOCATION FOR TREEMAP CHARTS
- STEPS TO INSERT A TREEMAP CHART IN EXCEL
- DIFFERENCE BETWEEN TREEMAP AND SUNBURST IN EXCEL
- NOTE:CHANGING THE NAME OF THE CHART, CHANGING THE AXIS , CHANGING THE CHART STYLE ETC.
INTRODUCTION
CHARTS are the graphic representation of any data . As we know that EXCEL is a super analytical tool.
Analysis of data is the process of deriving the inferences by finding out the trends, averages etc. about different parameters.
Excel provides us with a variety of charts and graphs to make our life easier. Although any chart can be used for any type of data, even then there are certain types which are apt for a particular type of data.
This is a standard excerpt for the charts.
Now, in this article , we will discuss about the TREEMAP CHARTS which are specifically designed to present the HIERARCHY of the processes or values.
The TREEMAP CHARTS represent the categories with the rectangle and subcategories with the smaller rectangles of the same color.
Not much of the information is given by the TREEMAP.
It just gives the hierarchy of the categories. Not much of the information can be extracted from the same.
Let us learn how to create a TREEMAP CHART in EXCEL.
WHEN TO USE TREEMAP CHARTS ?
- When we need to show the hierarchical map of any table.
- When we just need to know the inclusion and exclusion and not concerned with the values.
- When we just need to know about the sub categories and their comparative values.
BUTTON LOCATION FOR TREEMAP CHARTS
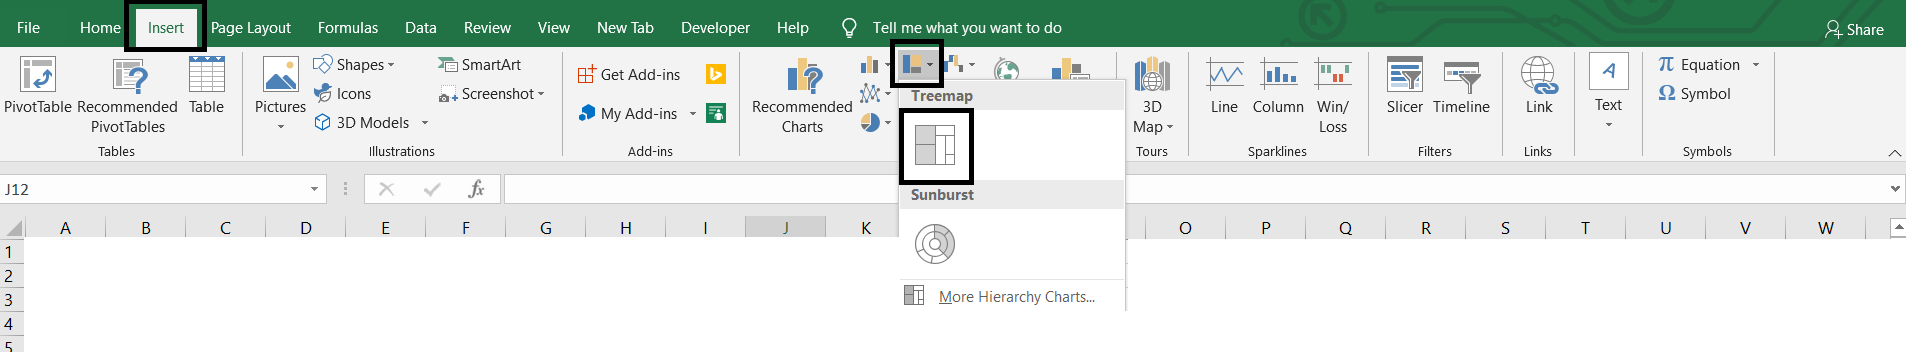
The button for column chart is found under the INSERT TAB >CHARTS SECTION under the button INSERT HIERARCHY CHARTS >TREEMAP CHART. The location is shown in the picture below.
STEPS TO INSERT A TREEMAP CHART IN EXCEL
EXAMPLE DETAILS
We can demonstrate the chart using an example.We are taking the example of a School Structure with student numbers.
We create a chart showing the number of classes with sections.
| DETAILS OF SCHOOL STRENGTH | |||
| SCHOOL | STANDARD | SECTION | NUMBER OF STUDENTS |
| A | I | A | 12 |
| B | 13 | ||
| II | A | 13 | |
| B | 14 | ||
| B | V | A | 32 |
| B | 34 | ||
| VI | A | 23 | |
| B | 32 |

The procedure to insert a treemap chart are as follows:
STEPS TO INSERT A TREEMAP CHART IN EXCEL:
- The first requirement of any chart is data. So create a table containing the data.[We have already created in the form of table above]
- Refer to our data above, we have the student strength of few classes of two different schools.
- Select the complete table including the HEADER NAMES.
- Go to INSERT TAB> CHARTS> and click the TREEMAP CHART under INSERT HIERARCHY CHARTS BUTTON as shown in the BUTTON LOCATION above and in the following picture for reference.
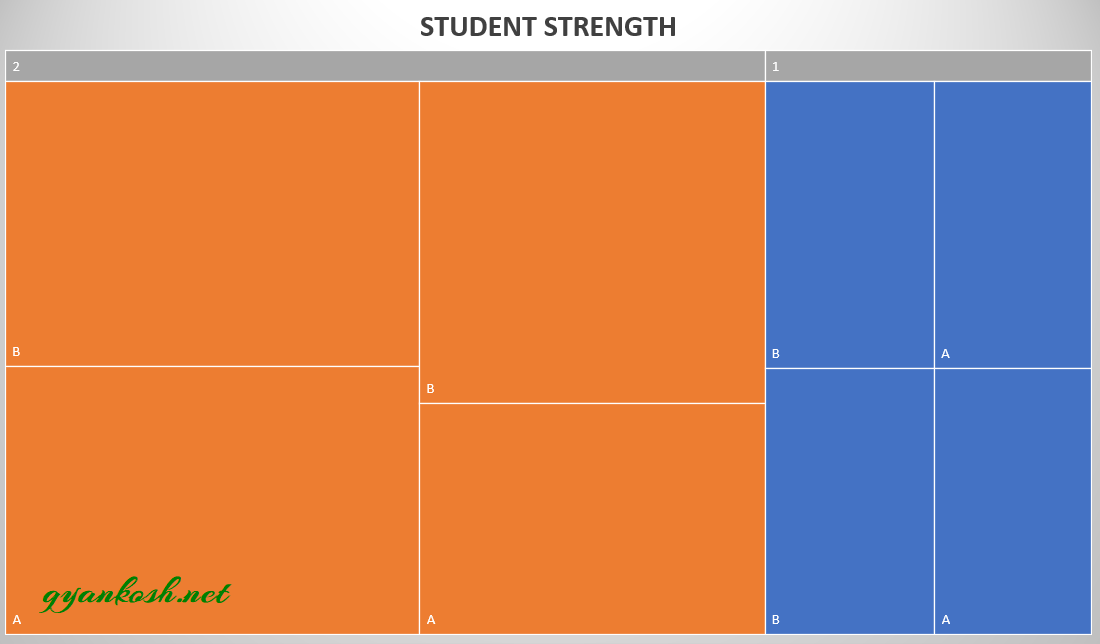
- The chart will be created and shown to you as the following figure.
The complete process is shown in the animated picture below.

So , we have successfully created a treemap chart.
The first level of series is represented by the topmost rectangles.The sub categories are represented by the smaller rectangles under the main series rectangles.
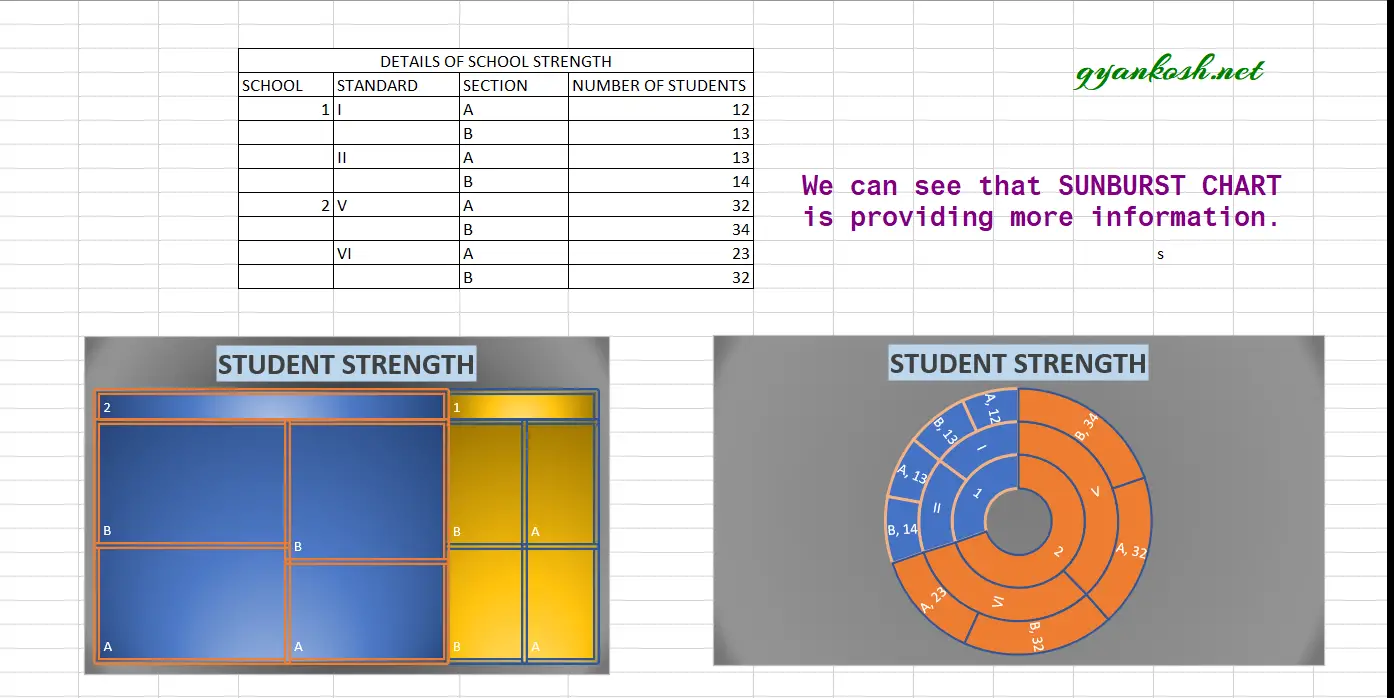
If we notice the chart, we can see that it took into consideration only the TOP CATEGORY and the last category with the values.
It omitted the rest whereas in our SUNBURST CHART, it shows all the categories and the exact hierarchy.
THE HIERARCHY IS SET FROM TOP TO BOTTOM AND LEFT TO RIGHT.
The final chart is shown below.
DIFFERENCE BETWEEN TREEMAP AND SUNBURST IN EXCEL
Treemap and Sunburst are the hierarchy charts available in the Excel.
Now, we know that we can use them when we need to show any hierarchical data, but let us find out which one should be used in a particular situation.
USE SUNBURST CHARTS WHEN
- We need to show all the hierarchy including all the categories and sub categories.
- When we need to show the values.
- When we are comfortable with the circular display of the chart.
USE TREEMAP CHARTS WHEN
- We need to show only the top category and the last subcategory before the values.
- When we need not to show the values necessarily.
- we want to show the data in the rectangles.
SUNBURST CHARTS comparatively better options if we don’t have any problem with circular display.
It is because it shows more information and is visually easier to interpret if we compare it with the TREEMAP CHARTS.
NOTE:CHANGING THE NAME OF THE CHART, CHANGING THE AXIS , CHANGING THE CHART STYLE ETC.
FOR ALL OTHER TASKS LIKE CHANGING THE NAME OF THE CHART, CHANGING THE AXIS , CHANGING THE CHART STYLE ETC. VISIT HERE [HOW TO CREATE A CHART IN EXCEL].