Table of Contents
- INTRODUCTION
- WHAT IS THE STANDARD DEVIATION?
- WHAT IS THE FORMULA FOR STANDARD DEVIATION?
- WHAT IS EXCEL FORMULA TO CALCULATE STANDARD DEVIATION ?
- WHICH SYMBOL REPRESENTS STANDARD DEVIATION?
- WHAT IS SYNTAX FORMULA OF STANDARD DEVIATION FUNCTION IN EXCEL?
- HOW TO CALCULATE STANDARD DEVIATION IN EXCEL?
- EXPLANATION:
- FAQs
INTRODUCTION
We make use of Statistical instruments to estimate the data spread in many ways. Data spread helps us to find out if the values tend towards any specific value or not.
One such instrument is STANDARD DEVIATION.
STANDARD DEVIATION SHOWS US THE DEVIATION OF THE DATA FROM THE MEAN.
Excel provides ready-to-use functions to calculate the standard deviation.
In this article, we’ll discuss the ways to calculate STANDARD DEVIATION in EXCEL using the functions.
WHAT IS THE STANDARD DEVIATION?
Standard Deviation is one of the frequently used statistical tools to know the dispersion of the data. Dispersion is the normal variation in the data.
STANDARD DEVIATION IS THE SQUARE ROOT OF THE SUM OF THE SQUARED VALUES OF THE DIFFERENCE BETWEEN THE VALUE AND THE MEAN OF THE DATA SET. IT SHOWS THE VARIATION OR DISPERSION OF ANY GIVEN DATASET.
For Example, let us take a dataset.
11, 9,14,8,14,12
The mean or average of the given dataset is 68/6=11.33.
Now, find out the difference between all the values and mean and square it.
The sum of the differences will become 31.3334.
Divide this by N-1 [In the definition we took it as N, but for a sample set from a bigger set, we’ll take the divisor as N-1 where N is the number of total terms. This is as per BESSEL’S CORRECTION.
STDEV, THE FUNCTION WILL MAKE USE OF THE DENOMINATOR AS N-1.
We have 6 terms, so we’ll divide by 5 and take its square root.
The result appears to be 2.503.
A lower SD [ Standard Deviation ] value shows that the values are near to the mean whereas a higher SD [ Standard Deviation ] shows that the values are Spread out over a bigger range.
SD is one of the methods to compare the distribution of the data. Distribution of the data helps us to predict the future values [ Forecasting ] or any other analysis.
WHAT IS THE FORMULA FOR STANDARD DEVIATION?
IF THE DATA IS A SAMPLE FROM THE ENTIRE DATA:
The standard formula for the STANDARD DEVIATION is  where x is the value,
IF THE DATA IS COMPLETE AND NOT A SAMPLE:
The standard formula for the STANDARD DEVIATION is  where x is the value,
WHAT IS EXCEL FORMULA TO CALCULATE STANDARD DEVIATION ?
Excel contains a bunch of STANDARD DEVIATION functions including old and new versions.
If we have to find the standard deviation of an unbiased data set where only a sample of the entire population is being taken into consideration, we’ll make use of the function STDEV. [ STANDARD DEVIATION ] and STDEV.S function which is a newer version of the older STDEV function.
STDEV FUNCTION IS FOR THE BACKWARD COMPATIBILITY ONLY and the newer STDEV.S is the absolutely same newer version.
If the data is complete, we’ll make use of the STDEV.P function.
We’ll discuss STDEV, STDEV.S, and STDEV.P functions in this article.
WHICH SYMBOL REPRESENTS STANDARD DEVIATION?
The symbol for STANDARD DEVIATION is SMALL SIGMA. Click Here to learn more about the symbol.
WHAT IS SYNTAX FORMULA OF STANDARD DEVIATION FUNCTION IN EXCEL?
The syntax formula of STANDARD DEVIATION FUNCTIONS are:
STDEV:
=STDEV(DATA RANGE) or STDEV(NUMBER 1, NUMBER 2,…)
STDEV.S:
=STDEV.S(DATA RANGE) or STDEV.S(NUMBER 1, NUMBER 2,…)
STDEV.P:
=STDEV.P(DATA RANGE) or STDEV.P(NUMBER 1, NUMBER 2,…)
HOW TO CALCULATE STANDARD DEVIATION IN EXCEL?
We just learned the manual way of calculating standard deviation in Excel but we don’t need to bother that much with the help of Excel.
Excel provides readymade functions which will provide us the result instantly.
We’ll make use of STDEV, STDEV.S, and STDEV.P functions to calculate.
Let us take an example for the same.
EXAMPLE:
The data is shown below. A sample of 100 values is taken.
| 146 | 375 | 589 | 504 | 815 | 129 | 351 | 867 | 534 | 128 |
| 490 | 640 | 120 | 182 | 357 | 198 | 411 | 738 | 494 | 627 |
| 746 | 727 | 284 | 321 | 276 | 377 | 290 | 147 | 187 | 622 |
| 737 | 419 | 805 | 568 | 425 | 706 | 735 | 352 | 214 | 390 |
| 784 | 690 | 393 | 229 | 605 | 233 | 418 | 210 | 527 | 714 |
FOLLOW THE STEPS TO FIND THE STANDARD DEVIATION IN EXCEL:
- Double click the cell where you want the result.
- Enter the function as
=STDEV( DATA RANGE) OR STDEV(NUMBER 1, NUMBER 2 …..) - Our data resides from the cell C3 to L7 so our range becomes C3:L7.
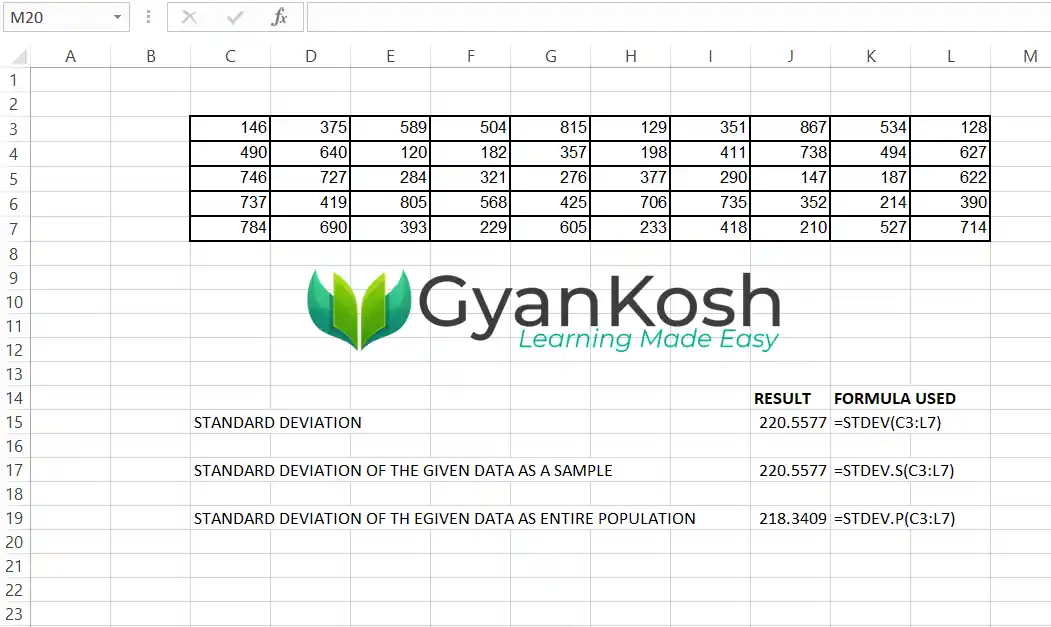
- The formula used is
- =STDEV(C3:L7)
- =STDEV.S(C3:L7)
- =STDEV.P(C3:L7)
The result appears as 220.5577 , 220.5577, 218.3409 respectively. Learn the reason of different results here. - The process is shown in the picture below.
EXPLANATION:
All three functions have been used in the example.
The STDEV and STDEV.S functions give the same result as STDEV.S is the newer version of the same old STDEV function.
STDEV.P function gives the results by dividing the expression by n instead of (n-1). All details have been discussed in the previous section. Due to this reason, the result is different.
In this article, we learned to find Standard Deviation using the STDEV, STDEV.S, and STDEV.P functions in Excel.
FAQs
WHAT IS THE DIFFERENCE BETWEEN STDEV AND STDEV.S FUNCTIONS?
There is no difference between the two. STDEV.S is the newer version of the two having the same arguments and results.
WHAT IS THE DIFFERENCE BETWEEN STDEV.S AND STDEV.P FUNCTIONS IN EXCEL?
STDEV.S (older STDEV FUNCTION) is used when we need to find out the standard deviation of a sample from the entire data whereas STDEV.P is used when we are taking the complete data in the calculation.
Simply speaking in the formula which is discussed above, the denominator is (n-1) in case of STDEV.S [ or STDEV] whereas the denominator is n in the case of STDEV.P which is the reason that the result of STDEV.S is higher than the result of STDEV.P.
It should be understood that if the data count is too high, both the functions will result in the almost same value.
WHAT IS THE RELATIONSHIP BETWEEN VARIANCE AND STANDARD DEVIATION ?
SQUARE OF STANDARD DEVIATION = VARIANCE.
IS THERE ANY FUNCTION TO CALCULATE STANDARD DEVIATION IN EXCEL?
Yes!! Excel has many STANDARD DEVIATION FORMULAS.
The normal Standard Deviation formula is STDEV.P which gives the exact result as the manual calculation.
If we take BESSEL’S CORRECTION or take a sample of the unknown data, STDEV.S or STDEV functions are used.
WHEN DO WE USE STDEV OR STDEV.P IN EXCEL?
When the complete data or entire population is given to you. It means the data is not a sample but all the data is given to you.
WHAT IS POPULATION STANDARD DEVIATION?
We call it POPULATION STANDARD DEVIATION when the entire population or data is given to you. We use STDEV.P function to calculate population standard deviation in Excel.
WHAT IS SAMPLE STANDARD DEVIATION?
We call it SAMPLE STANDARD DEVIATION when only a sample out of the entire population [ data ] . We use STDEV.S or STDEV to calculate this.