Table of Contents
- INTRODUCTION
- WHAT IS A WATERFALL CHART
- WHEN TO USE WATERFALL CHARTS
- BUTTON LOCATION FOR WATERFALL CHART IN GOOGLE SHEETS
- STEPS TO INSERT A WATERFALL CHART IN GOOGLE SHEETS
- NOTE:CHANGING THE NAME OF THE CHART, CHANGING THE AXIS , CHANGING THE CHART STYLE ETC.
INTRODUCTION
CHARTS are the graphic representation of any data . As we know that GOOGLE SHEETS provide us with a variety of charts.
Analysis of data is the process of deriving the inferences by finding out the trends, averages etc. about different parameters.
In this article we are going to discuss about the new WATERFALL CHARTS.
WATERFALL CHARTS are used for a particular situation when we need to see the intermediate values too, before arriving to a final value somewhat like cumulative values.
For Example, This charts starts with the zero and shows the positive as well as negative values shown by the floating columns of different colours, and final column shows the resultant value.
If we try to create a balance sheet using this type of chart, we can derive the net profit as the final value after adding up and deducting the various INs and OUTs of the business.
Let us check the procedure to insert a WATERFALL CHART in GOOGLE SHEETS
WHAT IS A WATERFALL CHART
A waterfall chart works like the flow of the water. A positive value is shown with a positive column.The base of the next column is the top of the previous column.Now, if the next figure is positive, it’ll further rise and if the next figure is negative, it’ll be like an inverted column from the base i.e. the tip of the previous column. Thus the waterfall chart behaves like a cumulative value which helps us to see the net effect at every step or value.
WHEN TO USE WATERFALL CHARTS
This chart should be used when we want to show the cumulative effect of a series. It means we want to have a look at all the intermediate values which arrives due to addition or subtraction of the values in the previous values.This chart is helpful in creating a visual statement for the inflow and outflow of the cash in financial environment.Or it can be used to get the cumulative values at different intervals of the series.
BUTTON LOCATION FOR WATERFALL CHART IN GOOGLE SHEETS
The WATERFALL CHART can be inserted through the INSERT MENU > CHART and choosing waterfall chart or by directly choosing the CHART BUTTON on the toolbar and then choosing the waterfall chart.
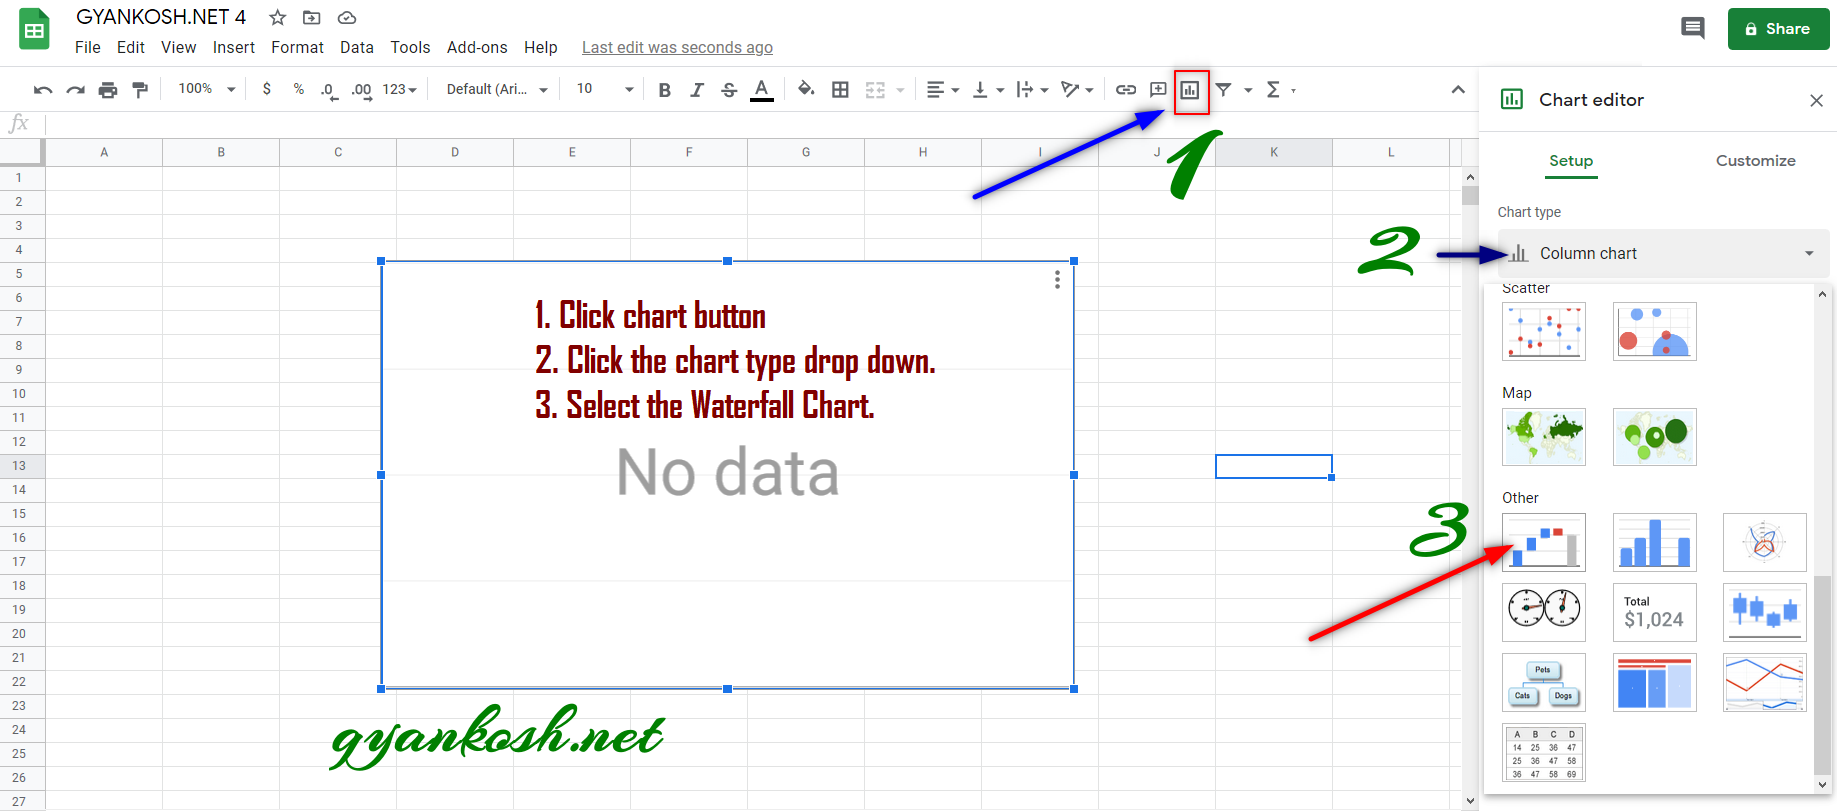
WATERFALL BUTTON ON TOOLBAR
- The chart button is situated on the right portion.
- Click the button. Chart Editor will open.
- Choose the WATERFALL CHART from the CHART TYPE DROP DOWN.
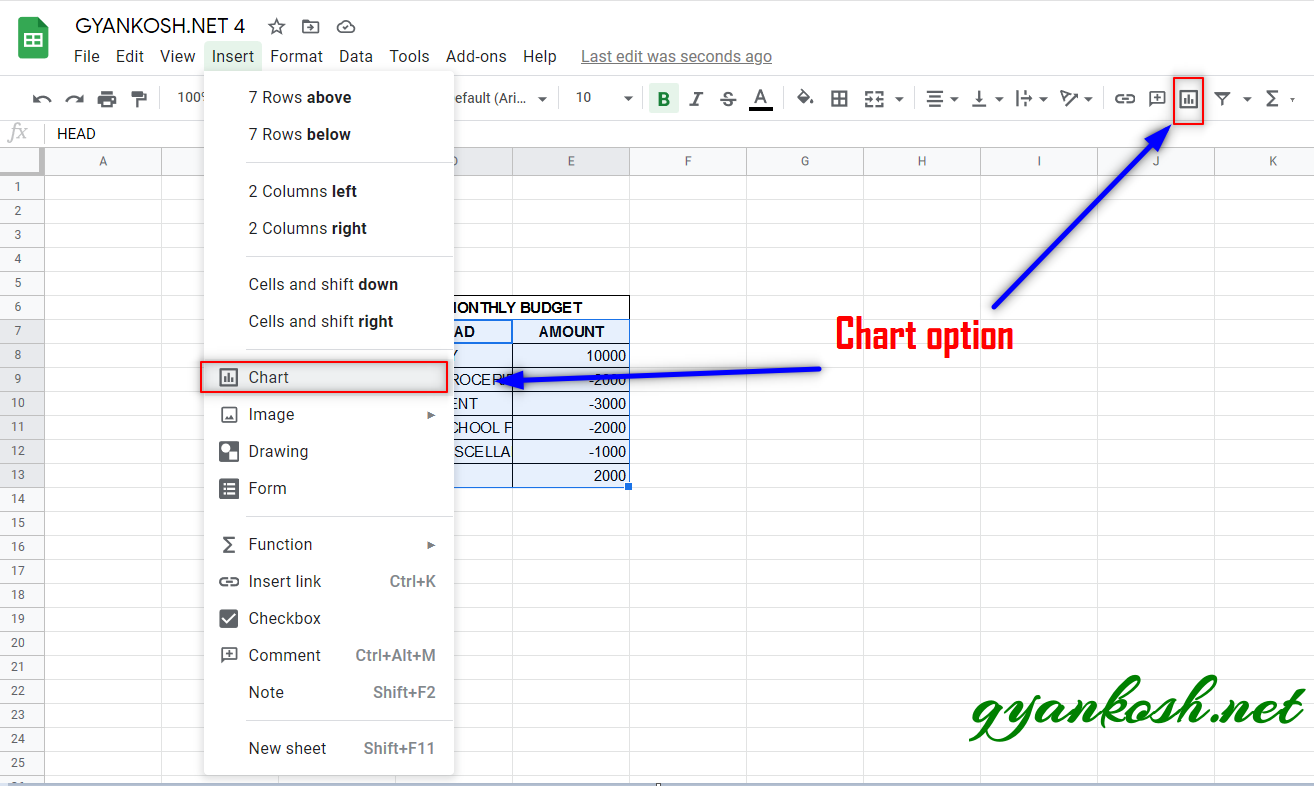
WATERFALL OPTION IN THE MENU
We can also choose the charts using the menu option.
- Go to INSERT MENU and choose Charts.
- Further the CHART EDITOR BOX will open.
- Choose WATERFALL CHART from the CHART TYPE DROP DOWN as shown in the picture above.

STEPS TO INSERT A WATERFALL CHART IN GOOGLE SHEETS
EXAMPLE DETAILS
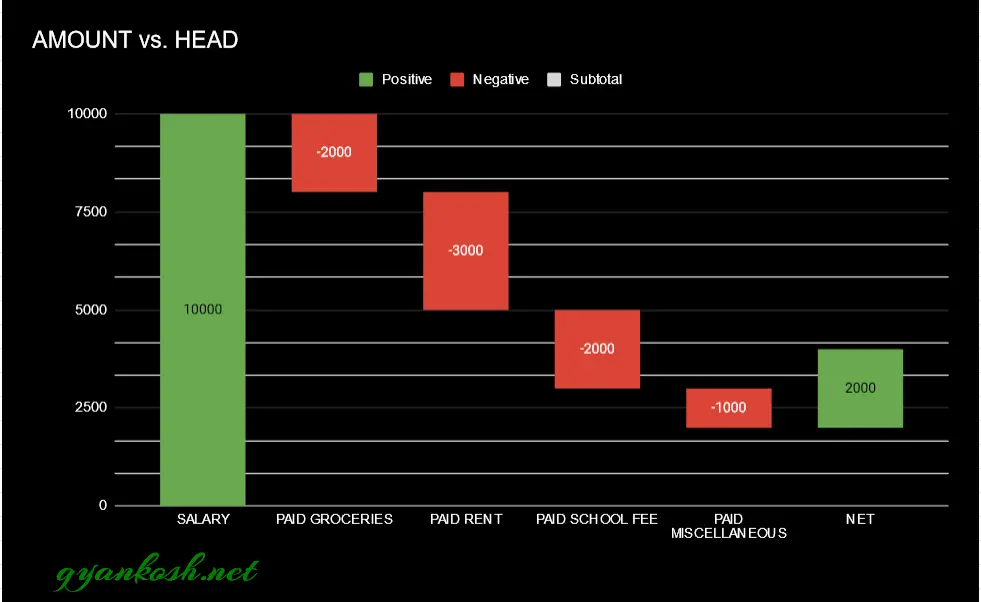
We can demonstrate the chart using an example.We are taking an example of monthly budget.We receive the salary and there are various expenses.The expenses in the WATER FALL CHART can be shown by putting parenthesis around the number or putting a – (negative) sign.Let us draw a water fall chart for the same.
| MONTHLY BUDGET | |
| HEAD | AMOUNT |
| SALARY | 10000 |
| PAID GROCERIES | -2000 |
| PAID RENT | -3000 |
| PAID SCHOOL FEE | -2000 |
| PAID MISCELLANEOUS | -1000 |
| NET | 2000 |
The procedure to insert a waterfall chart are as follows:
STEPS TO INSERT A WATERFALL CHART IN GOOGLE SHEETS:
- The first requirement of any chart is data. So create a table containing the data.[We have already created in the form of table above]
- Refer to our data above,we have created a small table for the monthly expenses.
- Select the complete table including the HEADER NAMES.
- Go to INSERT MENU and click CHARTS or Click Charts button directly from the toolbar.
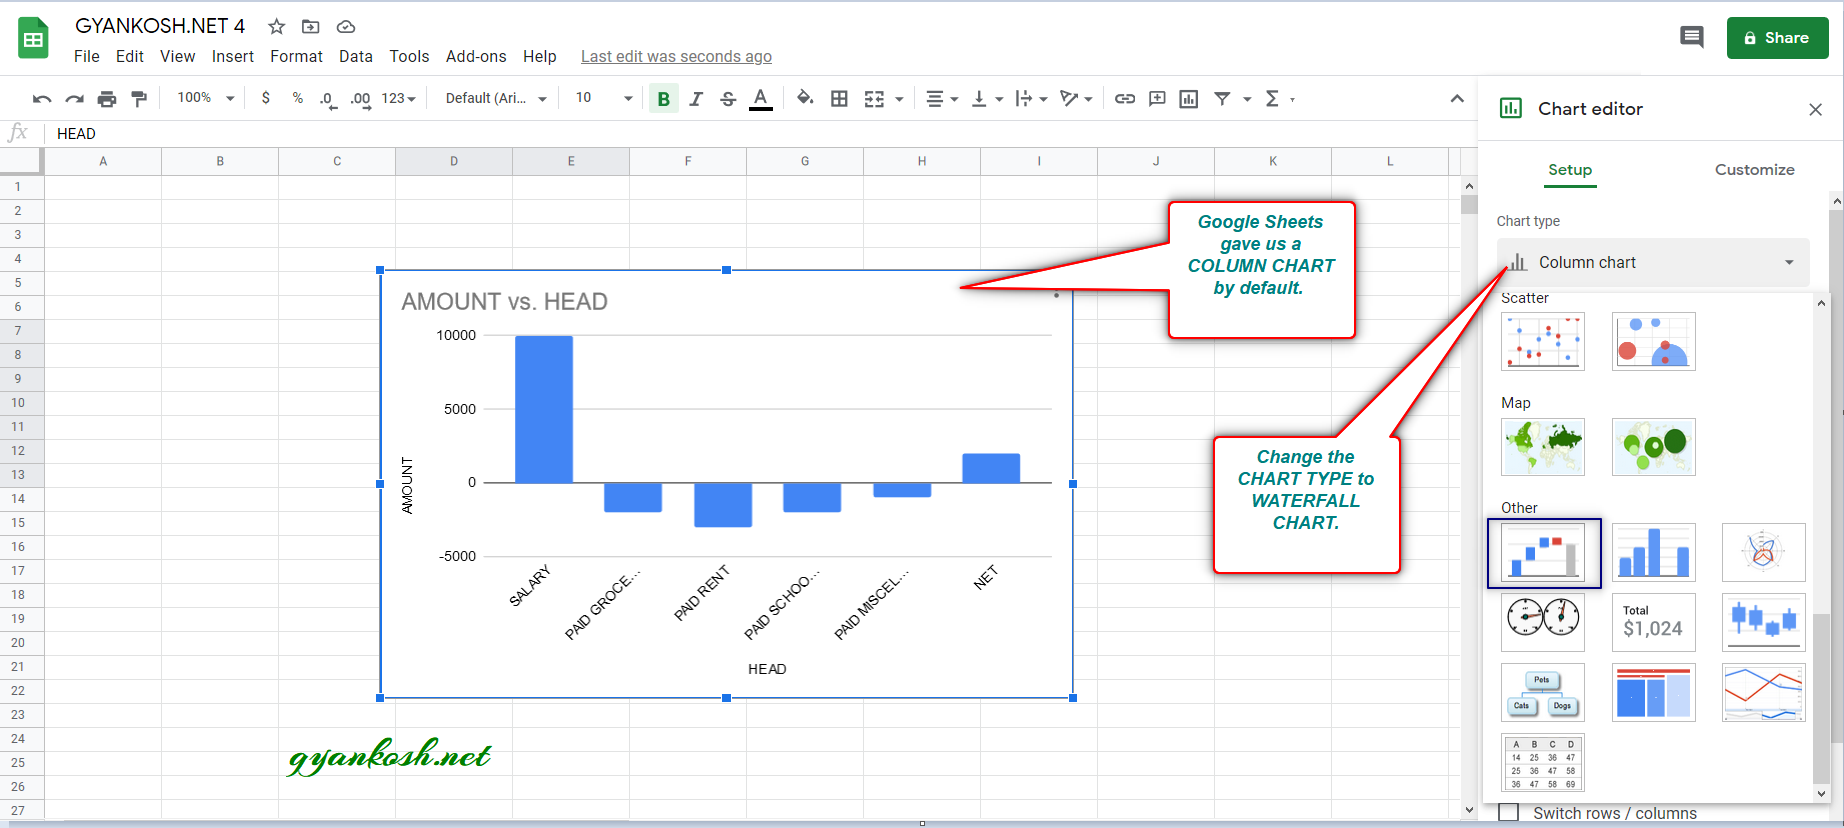
- After choosing the Chart option,Google Sheets will create a chart for us on the basis of the data.
- The chart can be any type. For our example, Google Sheets created a Column Chart.
- For changing the chart, go to Chart Type drop down and select WATER FALL CHART as shown in the picture below.
- As we select the desired WATERFALL CHART, the waterfall chart will be created instantly.
- The picture below shows the waterfall chart.
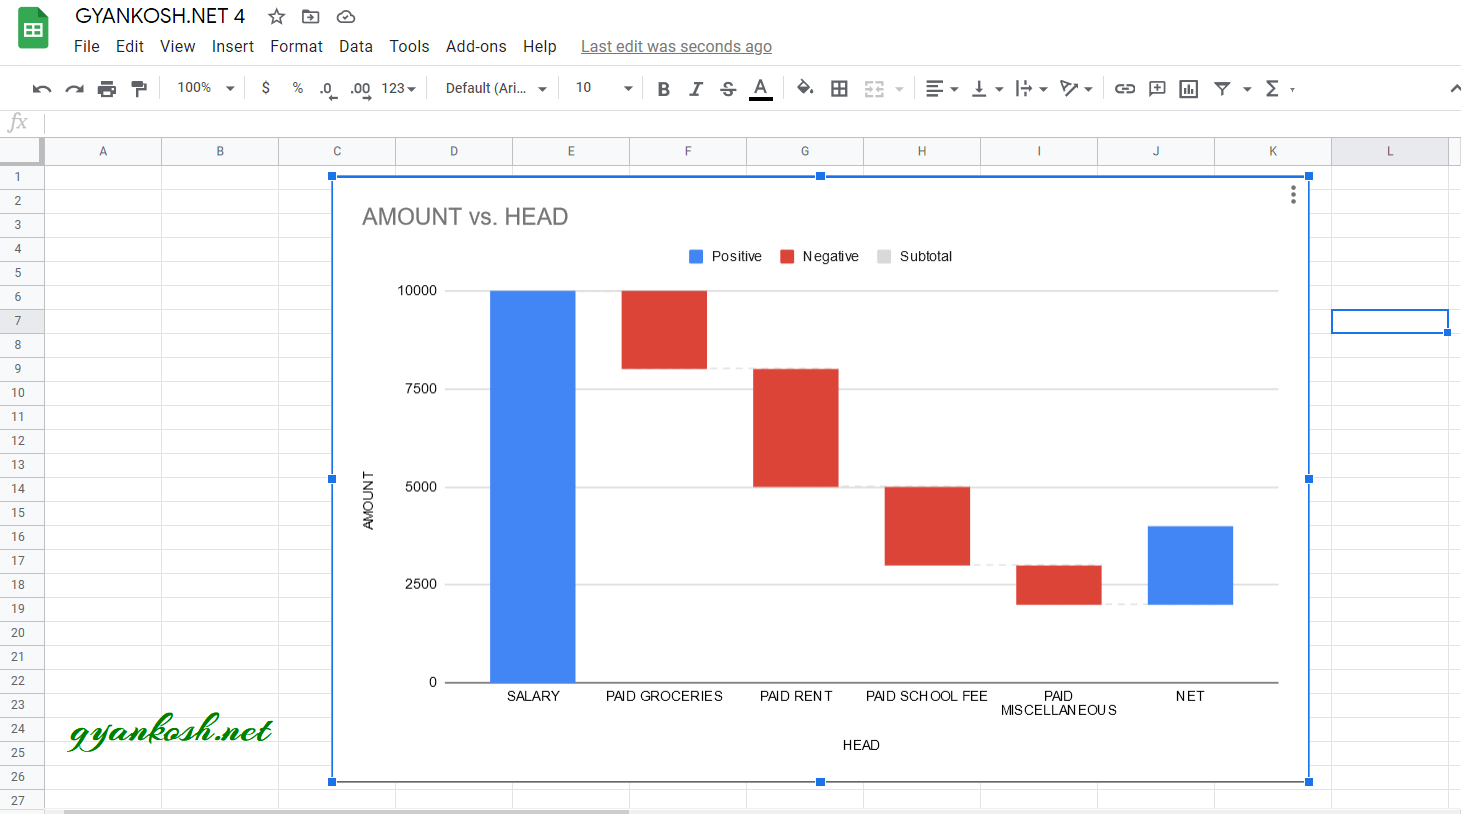
We have successfully created a Waterfall chart.After performing a few changes, the final Chat is shown below.
NOTE:CHANGING THE NAME OF THE CHART, CHANGING THE AXIS , CHANGING THE CHART STYLE ETC.
FOR ALL OTHER TASKS LIKE CHANGING THE NAME OF THE CHART, CHANGING THE AXIS , CHANGING THE CHART STYLE ETC. VISIT HERE [HOW TO CREATE A CHART IN GOOGLE SHEETS].