INTRODUCTION
As per INVESTOPEDIA.COM,
A stock (also known as equity) is a security that represents the ownership of a fraction of a corporation. This entitles the owner of the stock to a proportion of the corporation’s assets and profits equal to how much stock they own. Units of stock are called “shares.”
Whenever any corporation goes public, it offers the shares through an IPO.
People buy these entities for some price and after that these entities float in a share market exchange and people buy and sell them as per the profitability of the shares.
As the stocks have the fluctuations due to various reasons, many of the instruments which help us predicting the price movement of the stocks involve the mathematics and statistics.
We know that GOOGLE SHEETS is of a great help in performing many mathematical analysis with the help of many built in functions and other procedures. But the first requirement is getting the data into the GOOGLE SHEETS.
In this article, we’ll learn how to fetch the current data into Google Sheets.
WHY TO CREATE A STOCK PORTFOLIO ?
PORTFOLIO is the complete collection of your stocks with their quantities , current price, Initial price and net profit or loss. There can be other fields too but only the basic fields are enlisted.
Most of the time, we’ll always find that few of the stocks are performing good whereas other are performing bad.
The situation changes daily.
So, to keep a track of these , we always need to have a look at the complete portfolio to have a look at all the stocks we have.
Many options are already present for the same.
Google Sheets will specifically help us to do the further analysis once we get the data of the stocks which other applications can’t do.
We can analysis the stocks in our own way and don’t need to depend on others.
HOW TO GET THE STOCK DETAILS IN GOOGLE SHEETS ?
Google Sheets has a dedicated function called GOOGLEFINANCE which help us fetch the stock details of many scrips from the markets of all over the world.
The function has many options such as, current price, day’s high, day’s low, volume and so on.
This function help us to get the data into our Google Sheets sheet and we can perform the analysis after that.
SYNTAX OF GOOGLEFINANCE FUNCTION
Let us find out the way GOOGLEFINANCE FUNCTION is written
The GOOGLEFINANCE FUNCTION has the following syntax
=GOOGLEFINANCE(SYMBOL OF THE SECURITY INCLUDING THE EXCHANGE SYMBOL, ATTRIBUTE, START DATE, END DATE , INTERVAL)
SYMBOL OF THE SECURITY INCLUDING THE EXCHANGE SYMBOL is the ticker which you want to select or want the data information about. It should always be in the format NYSE:GOOG for the GOOGLE STOCK on NEWYORK STOCK EXCHANGE, NASDAQ:GOOG for NASDAQ and like that.
ATTRIBUTES
The attributes are the PARAMETERS which you want to fetch about the security.
The following list shows the attribute which can be used and their effect.
| price | – Real-time price quote, delayed by up to 20 minutes. |
| priceopen | – The price as of market open. |
| high | – The current day’s high price. |
| low | – The current day’s low price. |
| volume | – The current day’s trading volume. |
| marketcap | – The market capitalization of the stock. |
| tradetime | – The time of the last trade. |
| datadelay | – How far delayed the real-time data is. |
| volumeavg | – The average daily trading volume. |
| pe | – The price/earnings ratio. |
| eps | – The earnings per share. |
| high52 | – The 52-week high price. |
| low52 | – The 52-week low price. |
| change | – The price change since the previous trading day’s close. |
| beta | – The beta value. |
| changepct | – The percentage change in price since the previous trading day’s close. |
| closeyest | – The previous day’s closing price. |
| shares | – The number of outstanding shares. |
| currency | – The currency in which the security is priced. Currencies don’t have trading windows, so open, low, high, and volume won’t return for this argument. |
| HISTORICAL DATA | |
| open | – The opening price for the specified date(s). |
| close | – The closing price for the specified date(s). |
| high | – The high price for the specified date(s). |
| low | – The low price for the specified date(s). |
| volume | – The volume for the specified date(s). |
| all | – All of the above. |
| MUTUAL FUNDS | |
| closeyest | – The previous day’s closing price. |
| date | – The date at which the net asset value was reported. |
| returnytd | – The year-to-date return. |
| netassets | – The net assets. |
| change | – The change in the most recently reported net asset value and the one immediately prior. |
| changepct | – The percentage change in the net asset value. |
| yieldpct | – The distribution yield, the sum of the prior 12 months’ income distributions (stock dividends and fixed income interest payments) and net asset value gains divided by the previous month’s net asset value number. |
| returnday | – One-day total return. |
| return1 | – One-week total return. |
| return4 | – Four-week total return. |
| return13 | – Thirteen-week total return. |
| return52 | – Fifty-two-week (annual) total return. |
| return156 | – 156-week (3-year) total return. |
| return260 | – 260-week (5-year) total return. |
| incomedividend | – The amount of the most recent cash distribution. |
| incomedividenddate | – The date of the most recent cash distribution. |
| capitalgain | – The amount of the most recent capital gain distribution. |
| morningstarrating | – The Morningstar |
| expenseratio | – The fund’s expense ratio. |
START DATE is the date from when you want to fetch the data.
END DATE is the date till when you want to fetch the date.
INTERVAL is the interval of the values . It can be daily or weekly. The values can be put as 1 or 7 for daily and weekly respectively.
EXAMPLE 1: GET THE AMAZON PRICES FOR THE LAST 20 DAYS FROM NOW ON NASDAQ STOCK EXCHANGE
SOLUTION:
We’ll make use of the GOOGLEFINANCE function and fetch the price for last 20 days.
The result will return the result in multiple rows so we need to put the result in such a cell that there is no data under the function.
FOLLOW THE STEPS TO FETCH THE PRICE FOR LAST TWENTY DAYS
Double click the cell where you want the result.
Enter the function as =GOOGLEFINANCE(“NASDAQ:AMZN”,”PRICE”,TODAY()-20,TODAY(),”DAILY”)
Press Enter.
The result will be in the form of STOCK PRICE for the last 20 days. [ Weekends doesn’t provide any value so the number of days won’t be 20 in actual ].
EXPLANATION:
Let us understand the usage of the formula.
The formula used is
=GOOGLEFINANCE(“NASDAQ:AMZN”,”PRICE”,TODAY()-20,TODAY(),”DAILY”)
The first argument is NASDAQ:AMZN
AMZN is the code of amazon which you can find by simply searching for this on google.
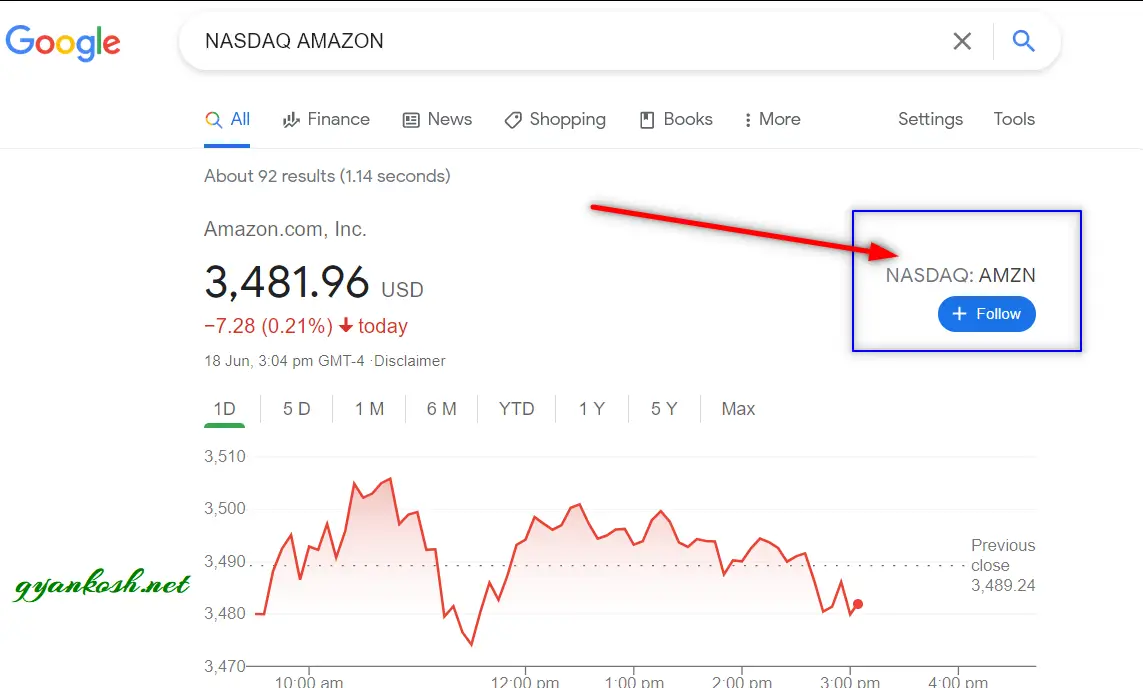
WRITE THE TICKER IN THIS FORMAT:
EXCHANGE : STOCK CODE
The second parameter is the ATTRIBUTE which we want to fetch.
We can simply put the name which we can refer from the TABLE GIVEN ABOVE for reference.
The third argument is the starting date, which is optional. In our example we have put the date as
TODAY()-20 which means the starting date is 20 days earlier from the day today. [ It’ll make it dynamic as everyday the value of TODAY() will change.
Fourth argument is TODAY() which is the latest date till which we want the data.
The fifth and final argument is DAILY which is the interval and will return the value of the stock for each day.
EXAMPLE 2: GET THE GOOGLE STOCK CURRENT PRICE FROM THE NASDAQ STOCK EXCHANGE
SOLUTION:
Whenever we are entering the argument 3 and 4 i.e. the starting date and ending date for fetching the stock data, the function gets the historical values.
If we simply ignore the 3,4,5 number argument, the values will be current.
THE VALUES FETCHED CAN BE DELAYED BY UP TO 20 MINUTES.
Let us fetch the current price of the GOOGLE from NASDAQ STOCK EXCHANGE.
FOLLOW THE STEPS TO FETCH CURRENT VALUES OF THE STOCKS
Double click the cell where you want the result to make it editable.
Enter the formula as =GOOGLEFINANCE(“NASDAQ:GOOG”,”PRICE”)
Press Enter.
The result will appear.
EXPLANATION:
The formula used is
=GOOGLEFINANCE(“NASDAQ:GOOG”,”PRICE”)
The first argument is simply THE EXCHANGE CODE and STOCK CODE.
The second argument is the attribute which we want to fetch.
It’ll return the current price of the stock.
STOCK PORTFOLIO TRACKER
Click the link and create a copy for yourself.
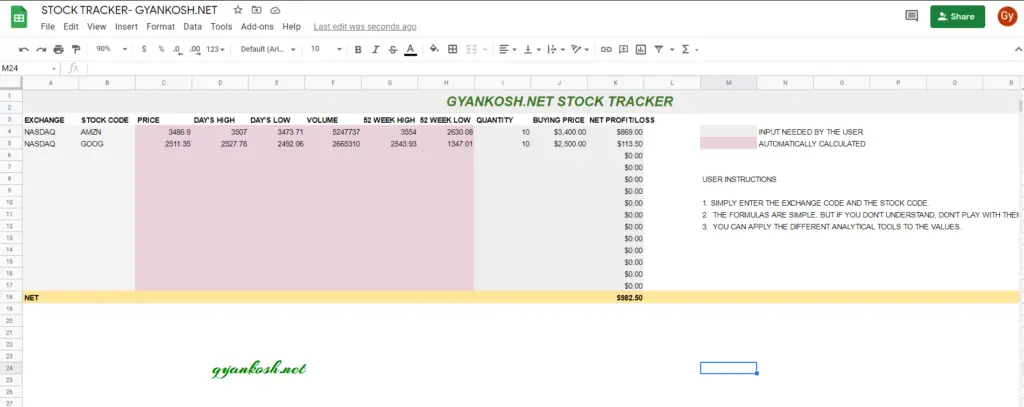
The following picture shows the screen of the portfolio tracker.
WHAT IS A PORTFOLIO TRACKER ?
A portfolio tracker is a central place where you can list all your stocks and track their status if they are in profit or loss individually and collectively.
As you can see in the picture above, we have a screen where we have fetched the different values of stocks which are useful for us.
We calculate the current value of our portfolio by finding out the difference between the buying value of the stocks and the current value of the stocks.
The picture above shows a simple portfolio tracker.
HOW TO USE PORTFOLIO TRACKER?
The link to create a copy of the tracker for yourself has already been shared. HERE.
Once you click the link, if you are logged in to your google account, it’ll simply take you to the page CREATE A COPY of the sheet.
Simply click it and this sheet’s copy will be yours. You can use it in your way afterwards.
If you are not logged in , you’ll be asked to login by google and after that the process is same.
If you don’t have a google account, you’ll need to register the account first, login and then you’ll be able to create a copy of the sheet.
After creating a copy, you’ll reach the following window.
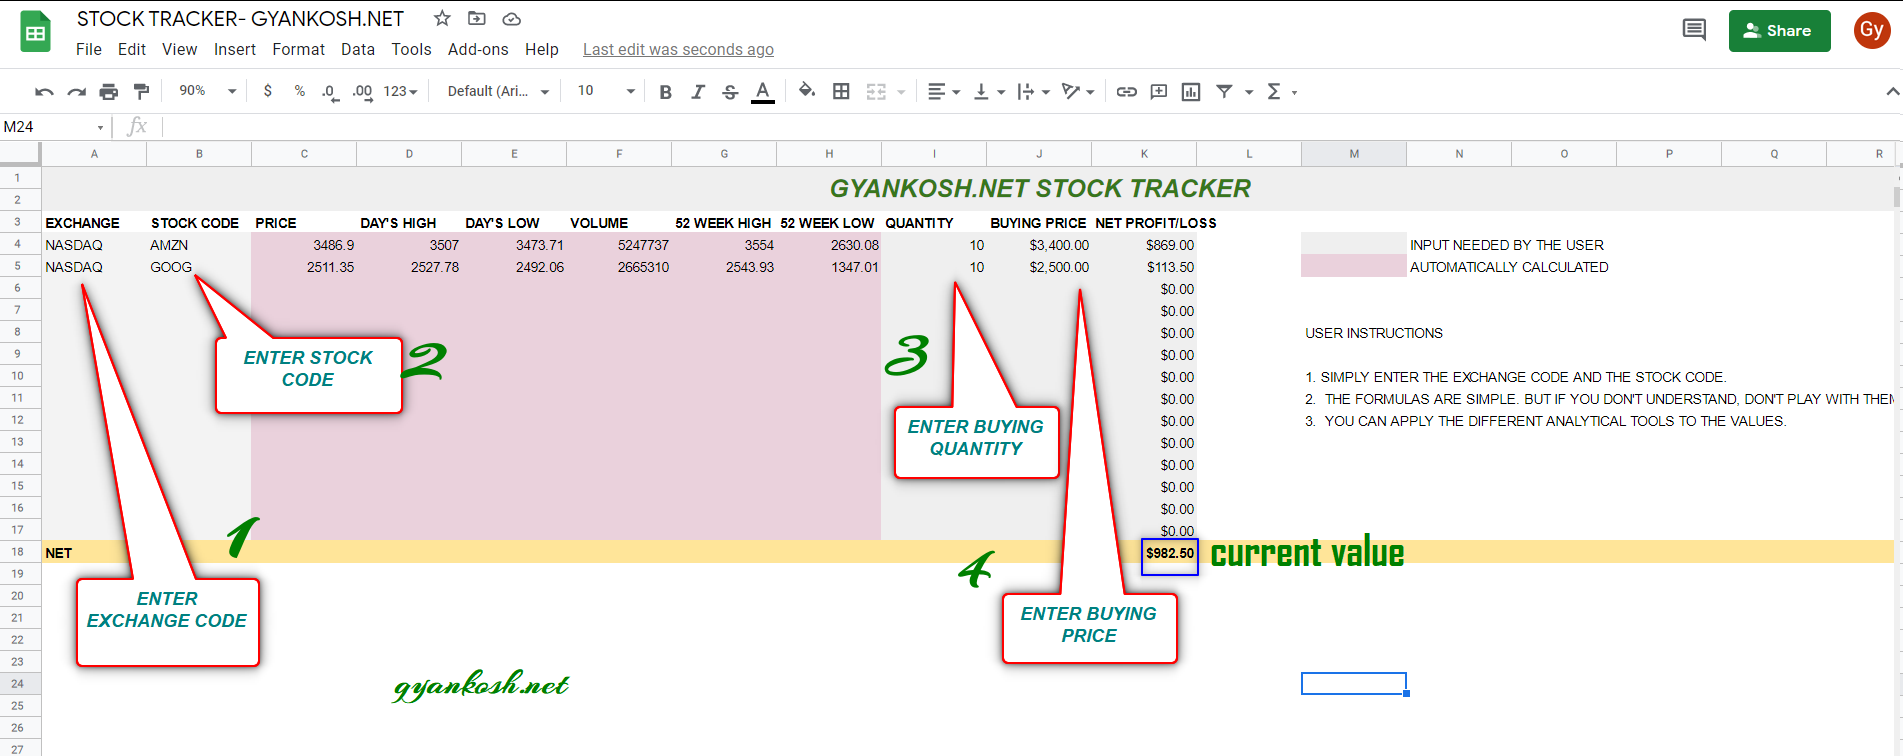
DIFFERENT AREAS OF THE TRACKER
The picture explains the different input areas of the tracker. Let us know about them a bit more
- ENTER EXCHANGE CODE
- EXCHANGE CODES can be found on this link. Not many of the exchanges are available yet.
- ENTER STOCK CODE
- You can find it on google by typing ” XYZ STOCK CODE”. A pic is shown where to find the code here.
- ENTER BUYING QUANTITY
- Simply enter the number of shares bought.
- ENTER BUYING PRICE
- Enter the buying price of the share.
After this information is put, we are ready to use the tracker.
HOW TO INSERT A NEW STOCK INTO THE PORTFOLIO
The process is very simple.
FOLLOW THESE STEPS TO INSERT NEW STOCK INTO THE PORTFOLIO
Enter the STOCK EXCHANGE CODE.
Enter the STOCK CODE.
Enter the buying quantity.
Enter the buying price.
We are done.
The calculations will be made as per the current price and the total will be shown at the bottom.
The complete process is shown below in the animated picture.
HOW TO INSERT A NEW STOCK IN THE TRACKER.
Although a few lines are already empty in the tracker.
If you want to enter more stocks, simply ADD ANY NUMBER OF ROWS ABOVE THE NET LINE which is at the bottom of the tracker.
TEMPLATE LINK
Click the link and choose MAKE A COPY