Table of Contents
- INTRODUCTION
- WHEN TO USE FUNNEL CHARTS
- BUTTON LOCATION FOR FUNNEL CHARTS
- STEPS TO INSERT A FUNNEL CHART IN EXCEL
- NOTE: CHANGING THE NAME OF THE CHART, CHANGING THE AXIS , CHANGING THE CHART STYLE ETC.
- FAQs
INTRODUCTION
CHARTS are the graphic representation of any data . We know that EXCEL is a super analytical tool.
Analysis of data is the process of deriving the inferences by finding out the trends, averages etc. about different parameters.
Although the data can be presented by any type of chart but even then there are certain charts which are perfectly suitable for a particular type of situation which makes it very easy to understand.
One such chart type is FUNNEL CHART which we will discuss in this article.
The funnel chart is a chart which looks like a funnel made up of the horizontal bars which keep on decreasing.
This chart is suitable to show any process which depict a filtering process. [ Where the output keep on reducing just like we filter something out.]
A process in which we start with a high number and it get filtered with every next stage and we are left with the final outcome.
This chart is available for the Excel 2019 and higher versions only.
WHEN TO USE FUNNEL CHARTS
FUNNEL CHARTS are specially meant for presenting the processes in which the number or value decreases with the stages.
It can be a statement of SALES ORDERS FINALIZED which starts with the Queries which are very high in number. After many stages only a few orders are finalized or realized.
This process shows any process which is like filtering.
The first stage is having the highest number and last or final stage is having the least.
BUTTON LOCATION FOR FUNNEL CHARTS
Let us find out where would we find the button for the FUNNEL CHARTS in EXCEL.
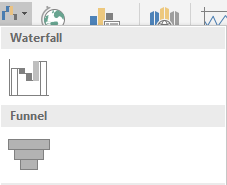
The button for funnel chart is found under the INSERT TAB under the CHARTS SECTION.
The button is Insert Waterfall, Funnel, Stock, Surface or Radar chart.
The location is shown in the picture below.
STEPS TO INSERT A FUNNEL CHART IN EXCEL
EXAMPLE DETAILS
We can demonstrate the chart using an example.We are taking the generalized example this time. We have the data of a fictitious process in which the value decreases with every increasing stage.
| STAGE | VALUE |
| STAGE 1 | 1000 |
| STAGE 2 | 845 |
| STAGE 3 | 700 |
| STAGE 4 | 550 |
| STAGE 5 | 220 |
The data shows a process in which the next stage has the decreased value in comparison with the first stage.
The procedure to insert a FUNNEL chart are as follows:
STEPS TO INSERT A FUNNEL CHART IN EXCEL:
- The first requirement of any chart is data. So create a table containing the data. [We have already created in the form of table above]
- Refer to our data above, we have a process having the five stages.
- Select the complete table including the HEADER NAMES.
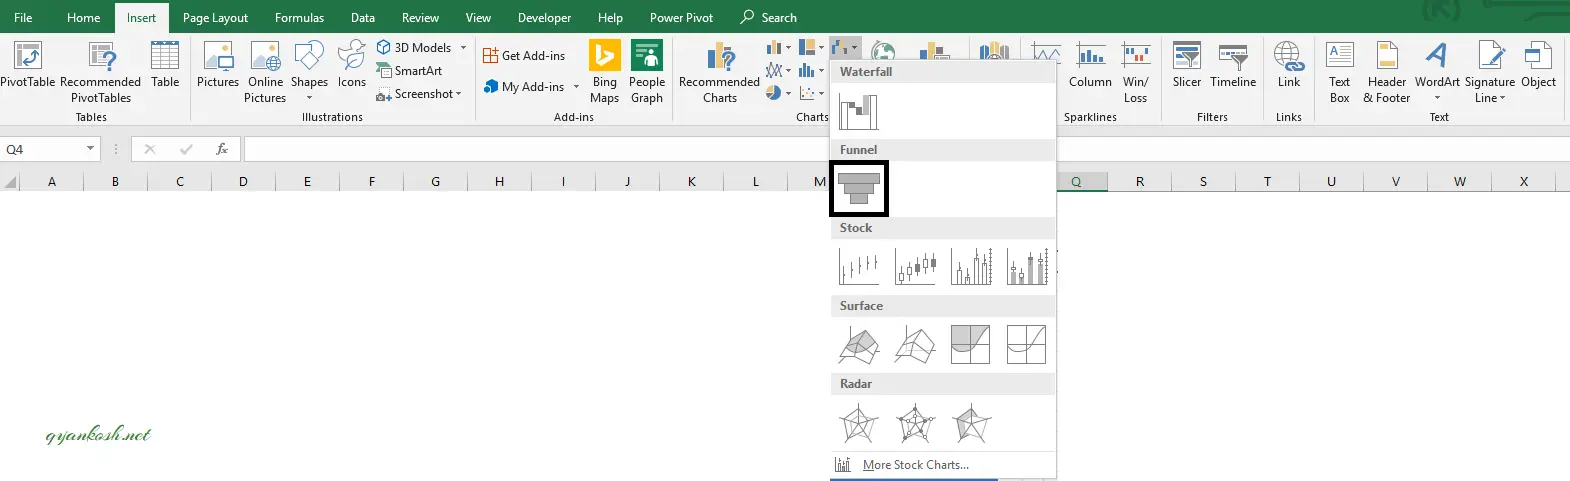
- Go to INSERT TAB> CHARTS> and click the FUNNEL button under Insert Waterfall, Funnel, Stock, Surface or Radar chart as shown in the BUTTON LOCATION above and in the following picture for reference.
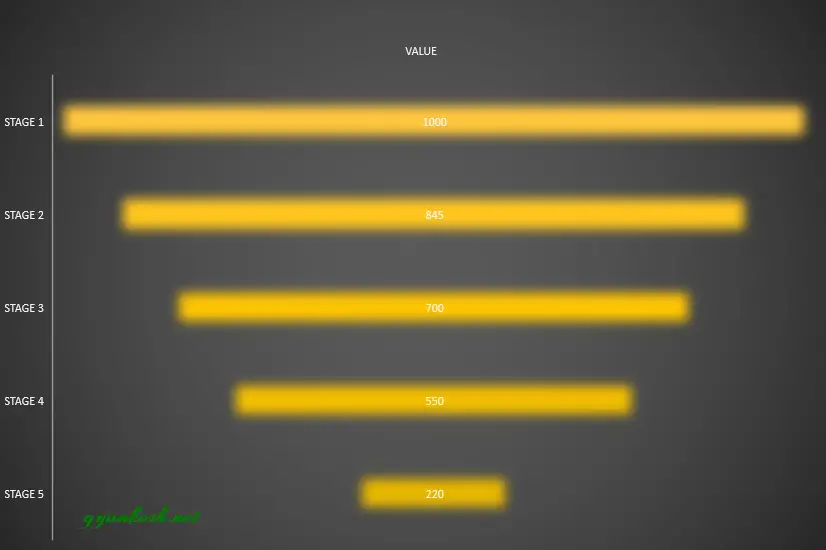
- The chart will be created and shown to you as the following figure.
The complete process is shown in the animated picture below.
So , we have successfully created a FUNNEL CHART in Excel.
The chart can be easily made and modified as per requirement.
We should use the chart only when a certain process fulfills our requirements as discussed in the section above.
The process should have the values decreasing otherwise the relevance of the chart will be no more.
After applying the styles , the final chart is shown below.
NOTE: CHANGING THE NAME OF THE CHART, CHANGING THE AXIS , CHANGING THE CHART STYLE ETC.
FOR ALL OTHER TASKS LIKE CHANGING THE NAME OF THE CHART, CHANGING THE AXIS , CHANGING THE CHART STYLE ETC. VISIT HERE [HOW TO CREATE A CHART IN EXCEL]
So this was the creation of funnel chart in Excel which is quite simple.
We can always go for the different customizations.
FAQs
I CAN’T FIND FUNNEL CHART IN MY EXCEL?
FUNNEL CHART appears only in the EXCEL VERSIONS 2019 OR LATER. So there are high chances that you don’t have the access to this chart type.