Table of Contents
- INTRODUCTION
- PURPOSE OF PIVOT CLAUSE IN GOOGLE QUERY LANGUAGE
- EXAMPLES:
- EXAMPLE DATA:
- EXAMPLE 1 : DISPLAY THE DATA ABOUT THE AVERAGE AGE OF THE EMPLOYEES WORKING IN DIFFERENT FIELDS
- EXAMPLE 2: FIND OUT THE AVERAGE EXPERIENCE OF THE EMPLOYEES IN THE DIFFERENT FIELDS
INTRODUCTION
GOOGLE SHEETS is a free SPREADSHEET APPLICATION for personal use and it is getting a good attention these days.
There are many useful functions which are found in almost all the spreadsheet apps like Google Sheets or Microsoft Excel or Open Calc and so on but every application has a certain special portion which is unique from the others.
One of such features in GOOGLE SHEETS is the use of the QUERY FUNCTION which enables us to use the SQL SERVER kind of queries on our data.
This QUERY LANGUAGE IS KNOWN AS THE GOOGLE VISUALIZATION API QUERY LANGUAGE and is almost similar to the SQL query language.
There are many standard clauses which are required to be understood so that we can make use of this powerful function easily.
In this article , we are going to focus on the clause PIVOT of GOOGLE SHEETS QUERY LANGUAGE and learn its use.
PURPOSE OF PIVOT CLAUSE IN GOOGLE QUERY LANGUAGE
Every clause in Google Sheets query language or Google query language or Google visualization api query language has a specific task to do.
One such requirement may arise when we need to get a result categorically or on the basis of some sort of classification.
In such cases we can use the clause PIVOT query in GOOGLE SHEETS QUERY LANGUAGE is very helpful.
THE PIVOT QUERY WILL CONVERT THE DISTINCT VALUES IN A COLUMN INTO NEW COLUMNS AS A RESULT OF THIS QUERY.
Don’t worry if you find this statement a bit confusing. Just keep reading and the things will get clearer.
Let us try to understand this in a simpler way.
Let us take an example to understand this.
For example,
If we have a column with different categories,
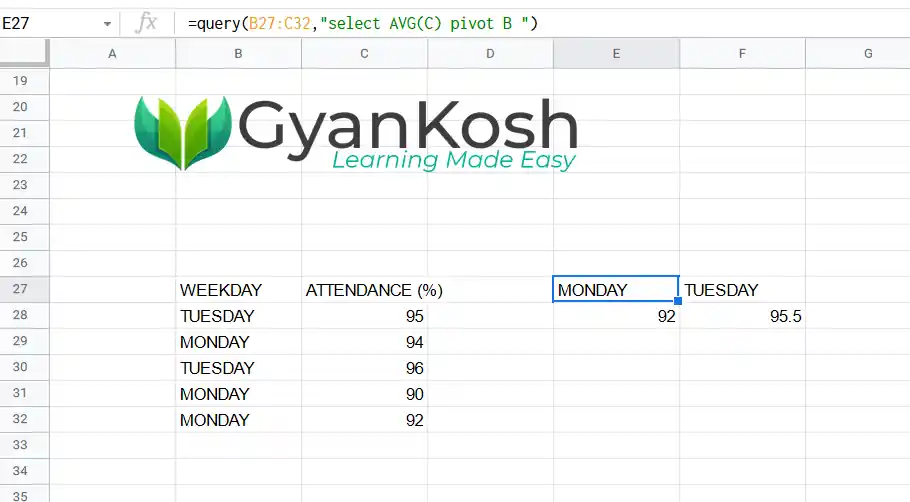
Say, the attendance of students on different days of the week.
Something like the data shown in the table below.
The following table shows the attendance on MONDAY and TUESDAY of a few weeks.
| WEEKDAY | ATTENDANCE (%) |
| TUESDAY | 95 |
| MONDAY | 94 |
| TUESDAY | 96 |
| MONDAY | 90 |
| MONDAY | 92 |
If we want to get any kind of aggregate data such as SUM, or AVG etc. for the attendance, DAY WISE [ The distinct values in a column ], we’ll use the PIVOT QUERY.
The result will look something like the one shown in the picture below.

So, this was the way in which we can make use of the PIVOT QUERY in GOOGLE SHEETS.
We’ll discuss a few simple examples now to check out the concept of PIVOT QUERY in GOOGLE SHEETS QUERY LANGUAGE.
EXAMPLES:
EXAMPLE DATA:
Let us take a random data and try out our newly learned clause – PIVOT.
The example shows a table containing the employee details such as EMPLOYEE ID, AGE , EXPERIENCE and WORK FIELD.
We’ll take a few examples to get the data from the above table in different ways to understand the PIVOT QUERY.
EXAMPLE 1 : DISPLAY THE DATA ABOUT THE AVERAGE AGE OF THE EMPLOYEES WORKING IN DIFFERENT FIELDS
SOLUTION:
In this example, we need to find out the average age with respect to the different departments or working areas or FIELDS.
This is an apt example to use the PIVOT QUERY. [If you remember the definition in the section here
FOLLOW THE STEPS TO CREATE A TABLE WITH THE AVERAGE AGES OF THE EMPLOYEES WORKING IN DIFFERENT WORK AREAS
- Select the cell where you want to get the result by double clicking it.
- Enter the function as =QUERY(B5:F18,”SELECT AVG(D) PIVOT F”,1).
QUERY EXPLANATION:
The QUERY used is =QUERY(B5:F18,"SELECT AVG(D) PIVOT F",1).
Select will populate the selected selected column.
We have asked the Query to get AVG(D) i.e. Average of the column D which contains the AGE of the employees.
The other column we need is the WORK AREAS or FIELD but as we are using PIVOT, it'll itself create the HEAD of the column.
So there is no need of the column in the Select which will be used in the Pivot.
- Press Enter.
- The result will appear as shown in the picture below.
We can see that with the help of a single statement , we could get a complete table with the desired format.
We could find out the average age in the different fields with the help of a single query.
EXAMPLE 2: FIND OUT THE AVERAGE EXPERIENCE OF THE EMPLOYEES IN THE DIFFERENT FIELDS
Let us take another simple example to learn the way to use the PIVOT QUERY.
FOLLOW THE STEPS TO GET THE AVERAGE EXPERIENCE OF THE EMPLOYEES IN THE DIFFERENT FIELDS:
- Select the cell where you want the result.
- Enter the formula as
=QUERY=QUERY(B5:F18,”SELECT AVG(E) PIVOT F”,1)
- Press ENTER.
- The result will appear as shown in the picture below.
THE RESULT IS A COMPLETE TABLE WITH THE DIFFERENT FIELDS SHOWING THE AVERAGE EXPERIENCE.